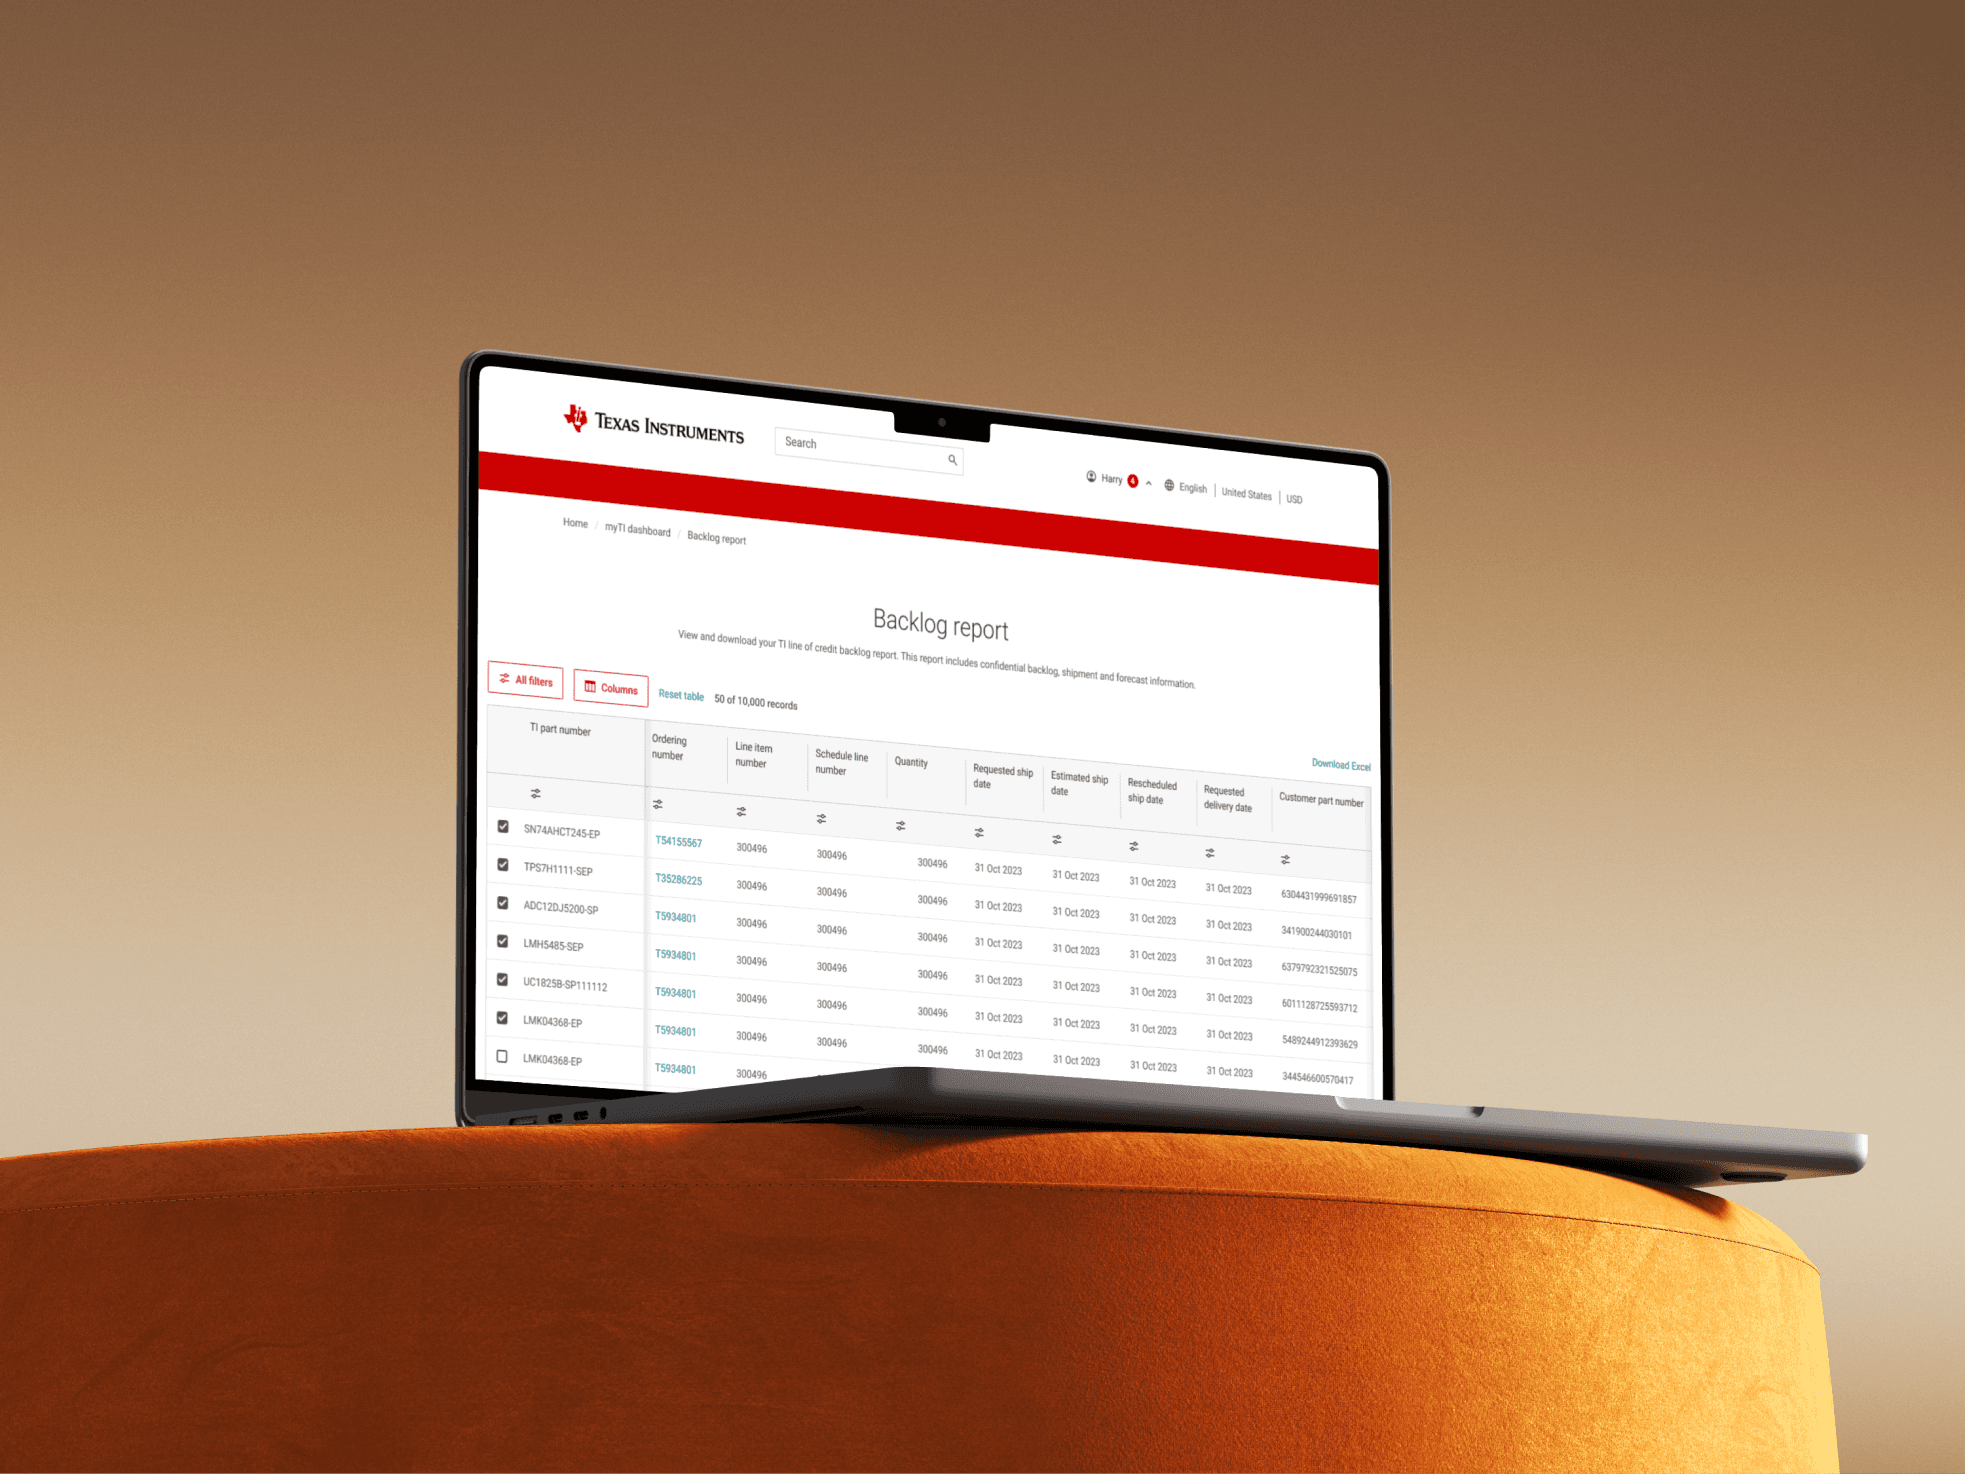
Backlog report self-service
Backlog report
self-service

Over 150,000 Customer service center tickets are generated annually by backlog customers who need access to their backlog, shipment, and invoice information.
Over 150,000 Customer service center tickets are generated annually by backlog customers who need access to their backlog, shipment, and invoice information.
Company
Texas Instruments, `Semiconductor B2B & B2C
My role
As a UX researcher and designer, I carried out global user interviews, online surveys, journey mapping, and co-facilitated a participatory workshop to gain insights into the requirements for backlog reports from both buyers and the internal sales team. Additionally, I developed a design system and UI components tailored specifically for AG-Grid tables.
Core team
Devin Slater, CD
Katie Sewell, UXS
Tanya Thao Quach, PM
Gloria Lee, UXW
Melanie Ryan, PO
Pricilla Ramos, PL & BA, Development
Tools
Figma, UXPIn, Miro, Webex, Jira, Confluence, AG-Grid
Timeline
6 design sprints (Aug-Nov 2023)
Company
Texas Instruments, Semiconductor B2B & B2C
My role
As a UX researcher and designer, I carried out global user interviews, online surveys, journey mapping, and co-facilitated a participatory workshop to gain insights into the requirements for backlog reports from both buyers and the internal sales team. Additionally, I developed a design system and UI components tailored specifically for AG-Grid tables.
Core team
Devin Slater, CD
Katie Sewell, UXS
Tanya Thao Quach, PM
Gloria Lee, UXW
Melanie Ryan, PO
Pricilla Ramos, PL & BA, Development
Tools
Figma, UXPIn, Miro, Webex, Jira, Confluence, AG-Grid
Timeline
6 design sprints (Aug-Nov 2023)
Description
Texas Instruments (TI) faced significant challenges with its manual backlog reporting process. The current system was cumbersome, prone to delays, and dependent on IT support to generate reports. This led to inefficiencies, poor real-time data access, and a disconnect between operational insights and decision-making. The goal was to design a self-service digital platform that empowered internal stakeholders—especially API super admin customers—to generate and customize backlog order reports seamlessly.
Business objectives
TI aimed to reduce manual intervention, improve report accuracy, and accelerate decision-making by providing real-time, customizable backlog order insights. The new system was expected to streamline operations, optimize resource allocation, and enhance overall business performance. Specifically, TI sought to decrease report generation time by 75%, improve data accessibility across departments, and foster a culture of data-driven decision-making.
Description
Texas Instruments (TI) faced significant challenges with its manual backlog reporting process. The current system was cumbersome, prone to delays, and dependent on IT support to generate reports. This led to inefficiencies, poor real-time data access, and a disconnect between operational insights and decision-making. The goal was to design a self-service digital platform that empowered internal stakeholders—especially API super admin customers—to generate and customize backlog order reports seamlessly.
Business objectives
TI aimed to reduce manual intervention, improve report accuracy, and accelerate decision-making by providing real-time, customizable backlog order insights. The new system was expected to streamline operations, optimize resource allocation, and enhance overall business performance. Specifically, TI sought to decrease report generation time by 75%, improve data accessibility across departments, and foster a culture of data-driven decision-making.
02. Business and design considerations
During the workshop with stakeholders, we brainstorm the who, what, when, where, why, and how as the starting point for elaborating the design content and objectives.
Brainstorming
Who are the primary users of the backlog report self-service system?
What problems are users facing with the current backlog report process?
When and how do users interact with backlog reports?
Where are the design opportunities to improve the current system?
Why is a self-service system important for backlog report management?
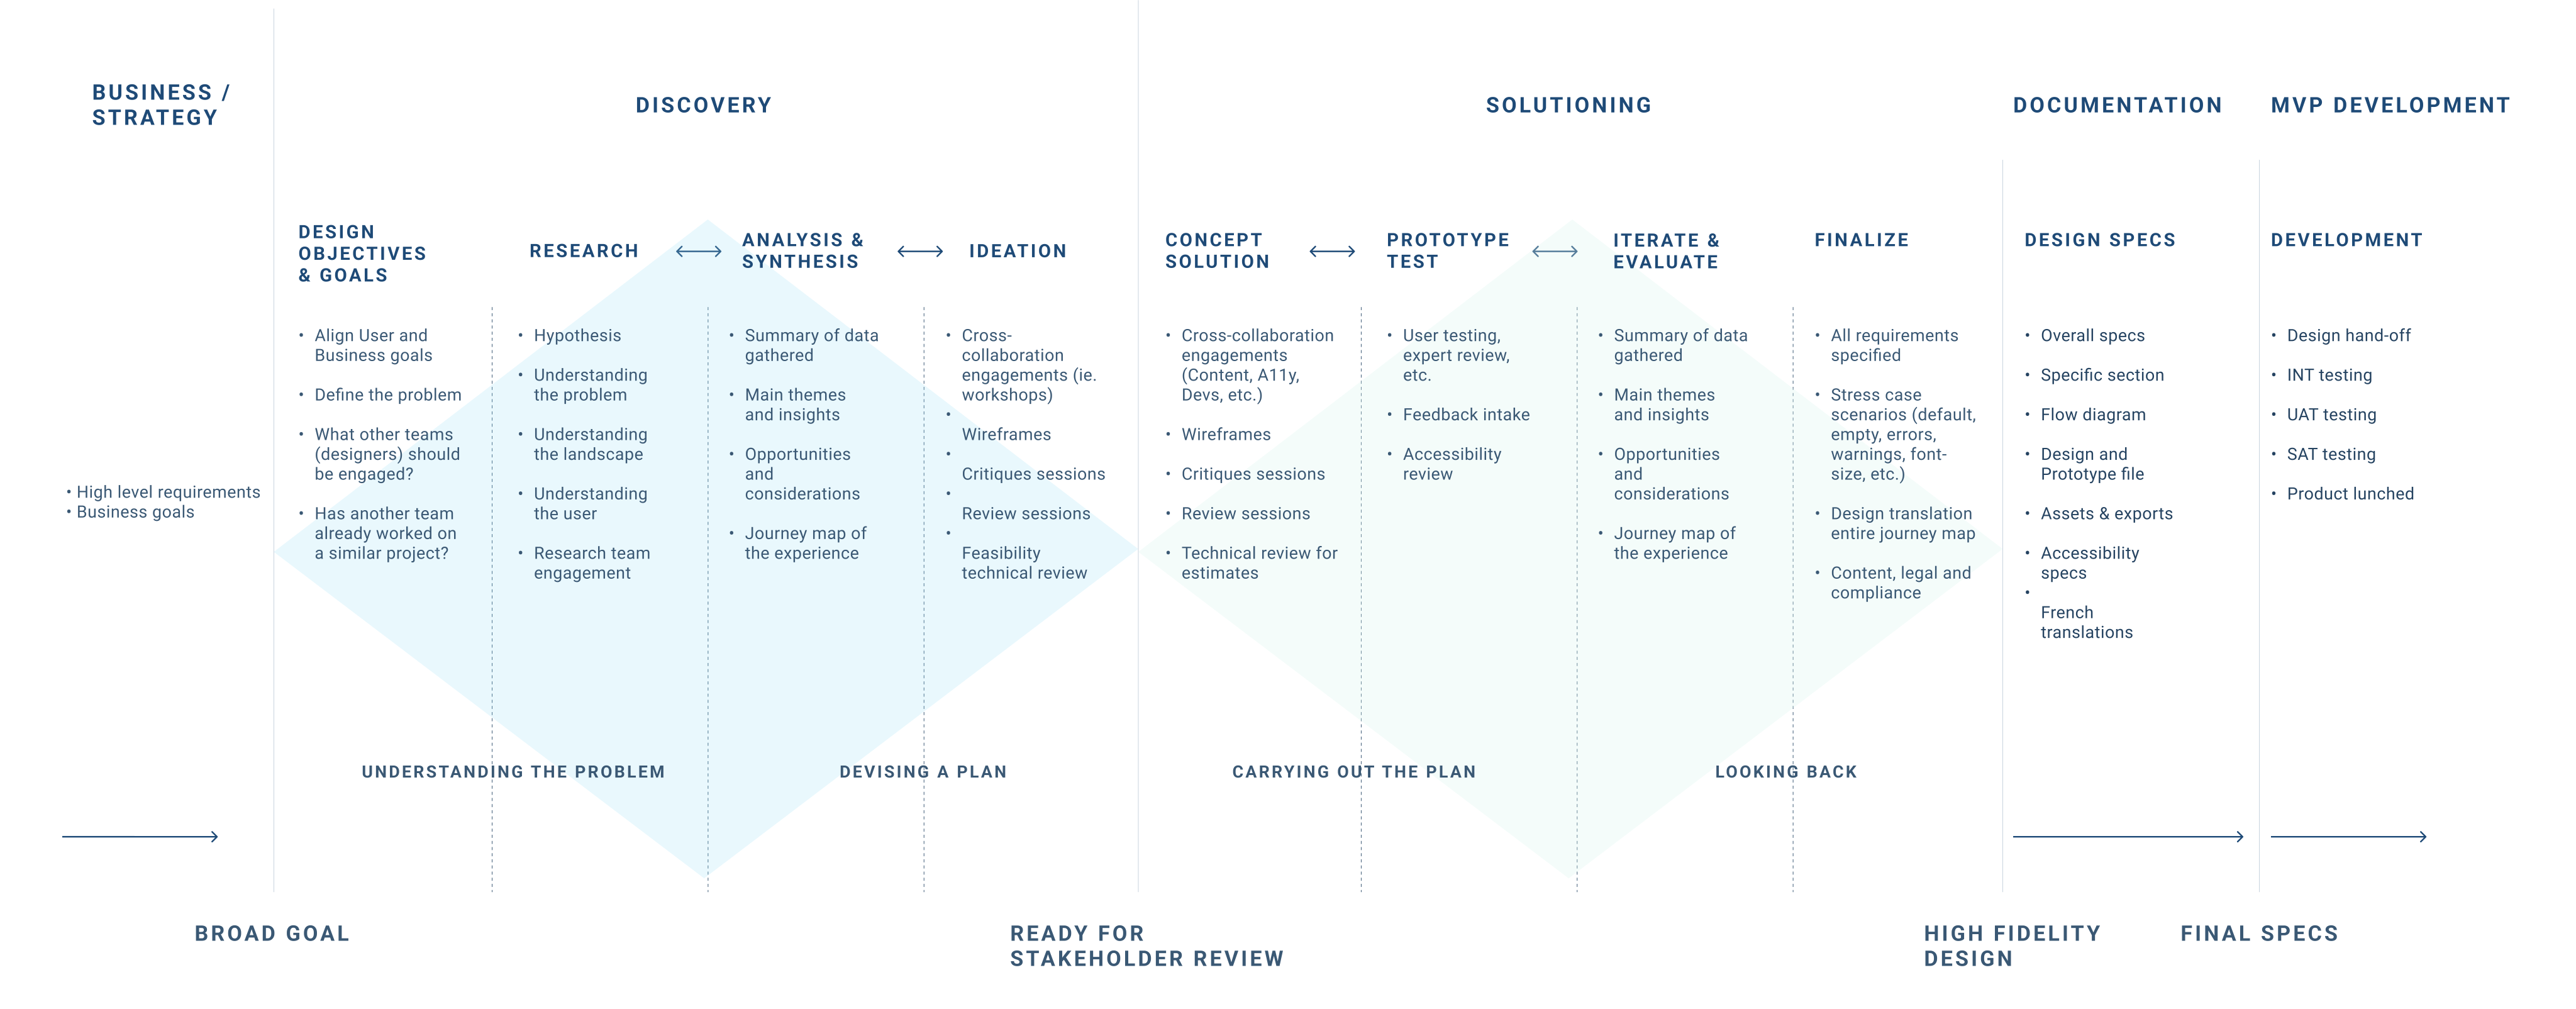
01. Process overview
01. Process overview
02. Business and design considerations
During the workshop with stakeholders, we brainstorm the who, what, when, where, why, and how as the starting point for elaborating the design content and objectives.
Brainstorming
Who are the primary users of the backlog report self-service system?
What problems are users facing with the current backlog report process?
When and how do users interact with backlog reports?
Where are the design opportunities to improve the current system?
Why is a self-service system important for backlog report management?
0.3 Design challenges
0.3 Design challenges
CHALLENGE #1
CHALLENGE #1
Presenting large volumes of backlog, shipping, and ordering data in a clear, user-friendly format without overwhelming users.
Presenting large volumes of backlog, shipping, and ordering data in a clear, user-friendly format without overwhelming users.
CHALLENGE #2
CHALLENGE #2
Ensuring real-time updates are accurate and synchronized without causing system lags or data discrepancies.
Ensuring real-time updates are accurate and synchronized without causing system lags or data discrepancies.
CHALLENGE #3
CHALLENGE #3
Integrating data from various legacy systems, APIs, and third-party logistics platforms, each with different structures and update frequencies.
Integrating data from various legacy systems, APIs, and third-party logistics platforms, each with different structures and update frequencies.
CHALLENGE #4
CHALLENGE #4
Designing for diverse users (e.g., API super admins, operations managers, distributors) with different goals, requiring tailored dashboards and permission-based views.
Designing for diverse users (e.g., API super admins, operations managers, distributors) with different goals, requiring tailored dashboards and permission-based views.
CHALLENGE #5
CHALLENGE #5
Simplifying complex workflows without sacrificing advanced filtering, search capabilities, or customization options needed by power users.
Simplifying complex workflows without sacrificing advanced filtering, search capabilities, or customization options needed by power users.
CHALLENGE #6
CHALLENGE #6
Meeting WCAG standards to ensure all users, including those with disabilities, can access and navigate the system effortlessly.
Meeting WCAG standards to ensure all users, including those with disabilities, can access and navigate the system effortlessly.
CHALLENGE #1
CHALLENGE #1
Creating a responsive design that works seamlessly across desktops, tablets, and mobile devices without losing critical functionalities.
Creating a responsive design that works seamlessly across desktops, tablets, and mobile devices without losing critical functionalities.
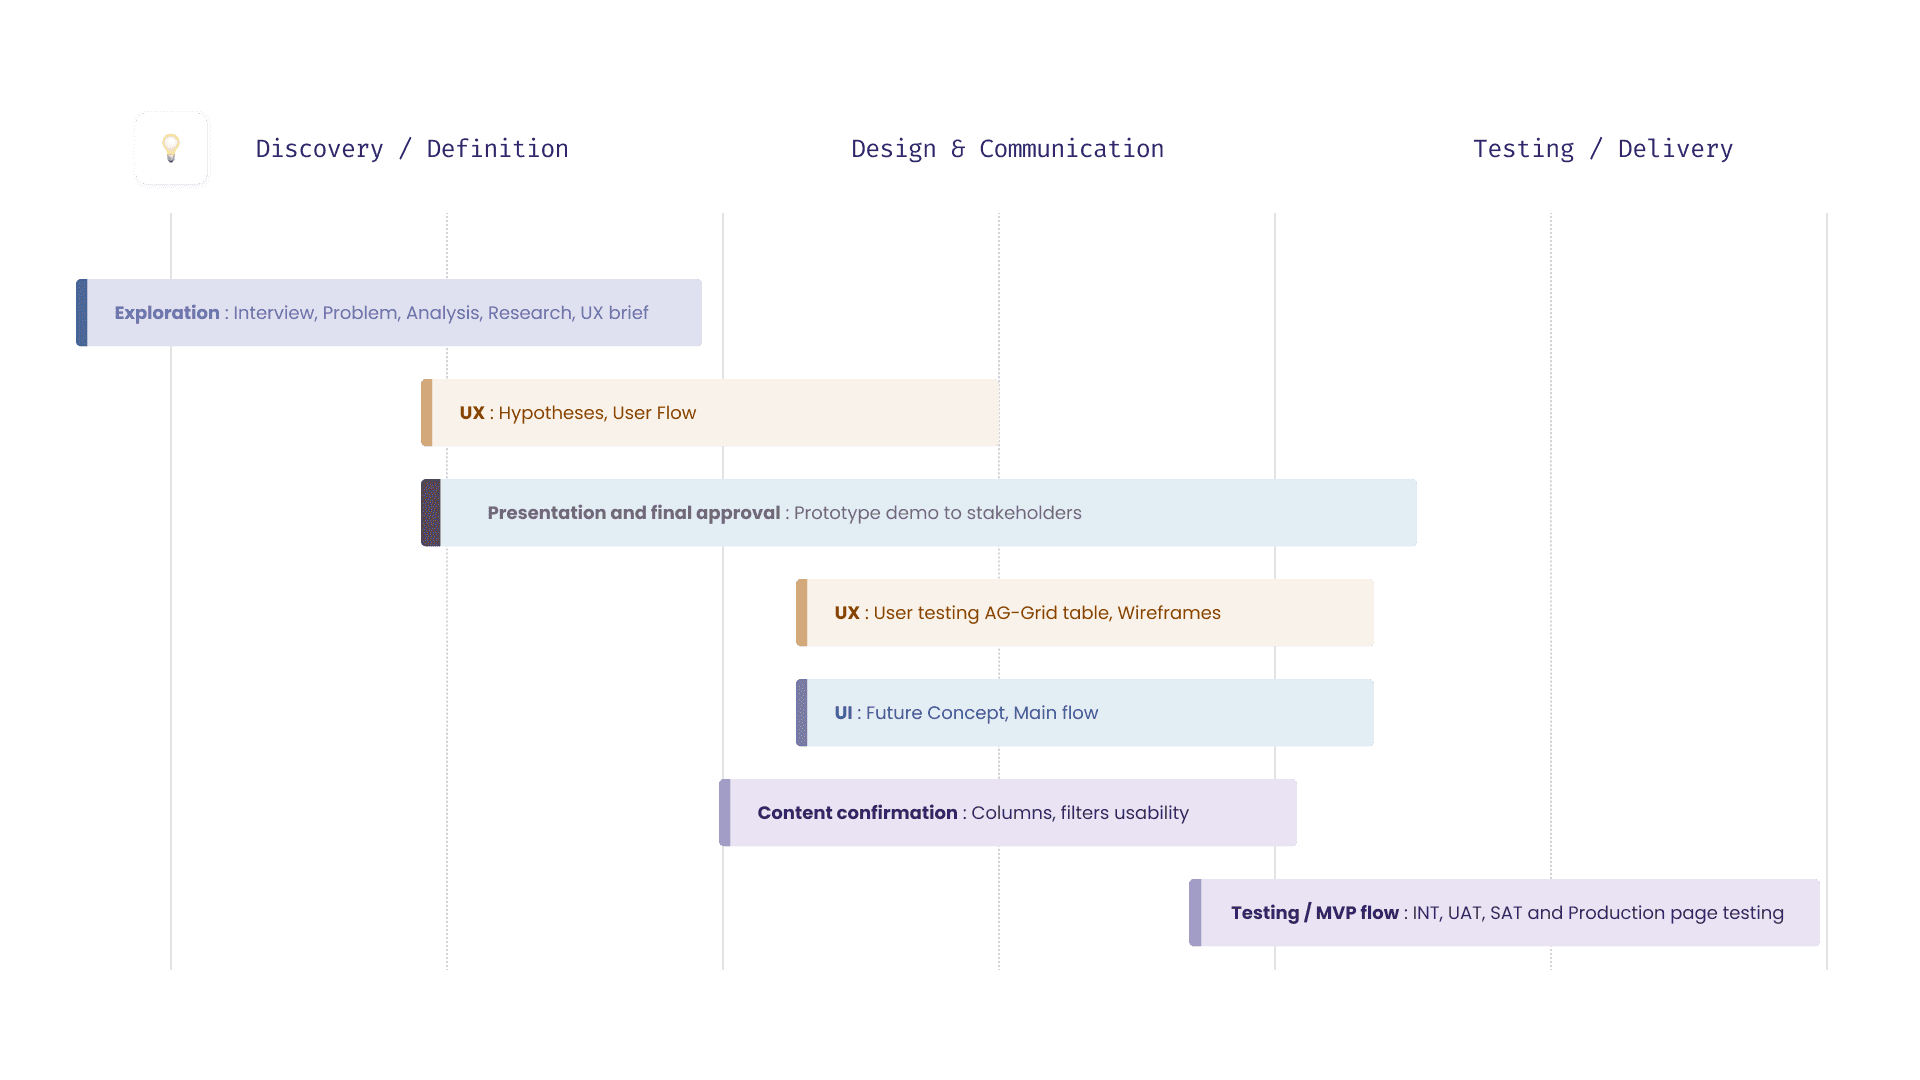
03. Project timeline
03. Project timeline
I conduct user experience evaluations, adapt plans based on insights, collaborate with developers for precise implementation, and prioritize accessibility and inclusivity, leveraging data-driven strategies and WCAG compliance to ensure user-friendly, high-quality designs.
I conduct user experience evaluations, adapt plans based on insights, collaborate with developers for precise implementation, and prioritize accessibility and inclusivity, leveraging data-driven strategies and WCAG compliance to ensure user-friendly, high-quality designs.
04. User persona 1
04. User persona 1
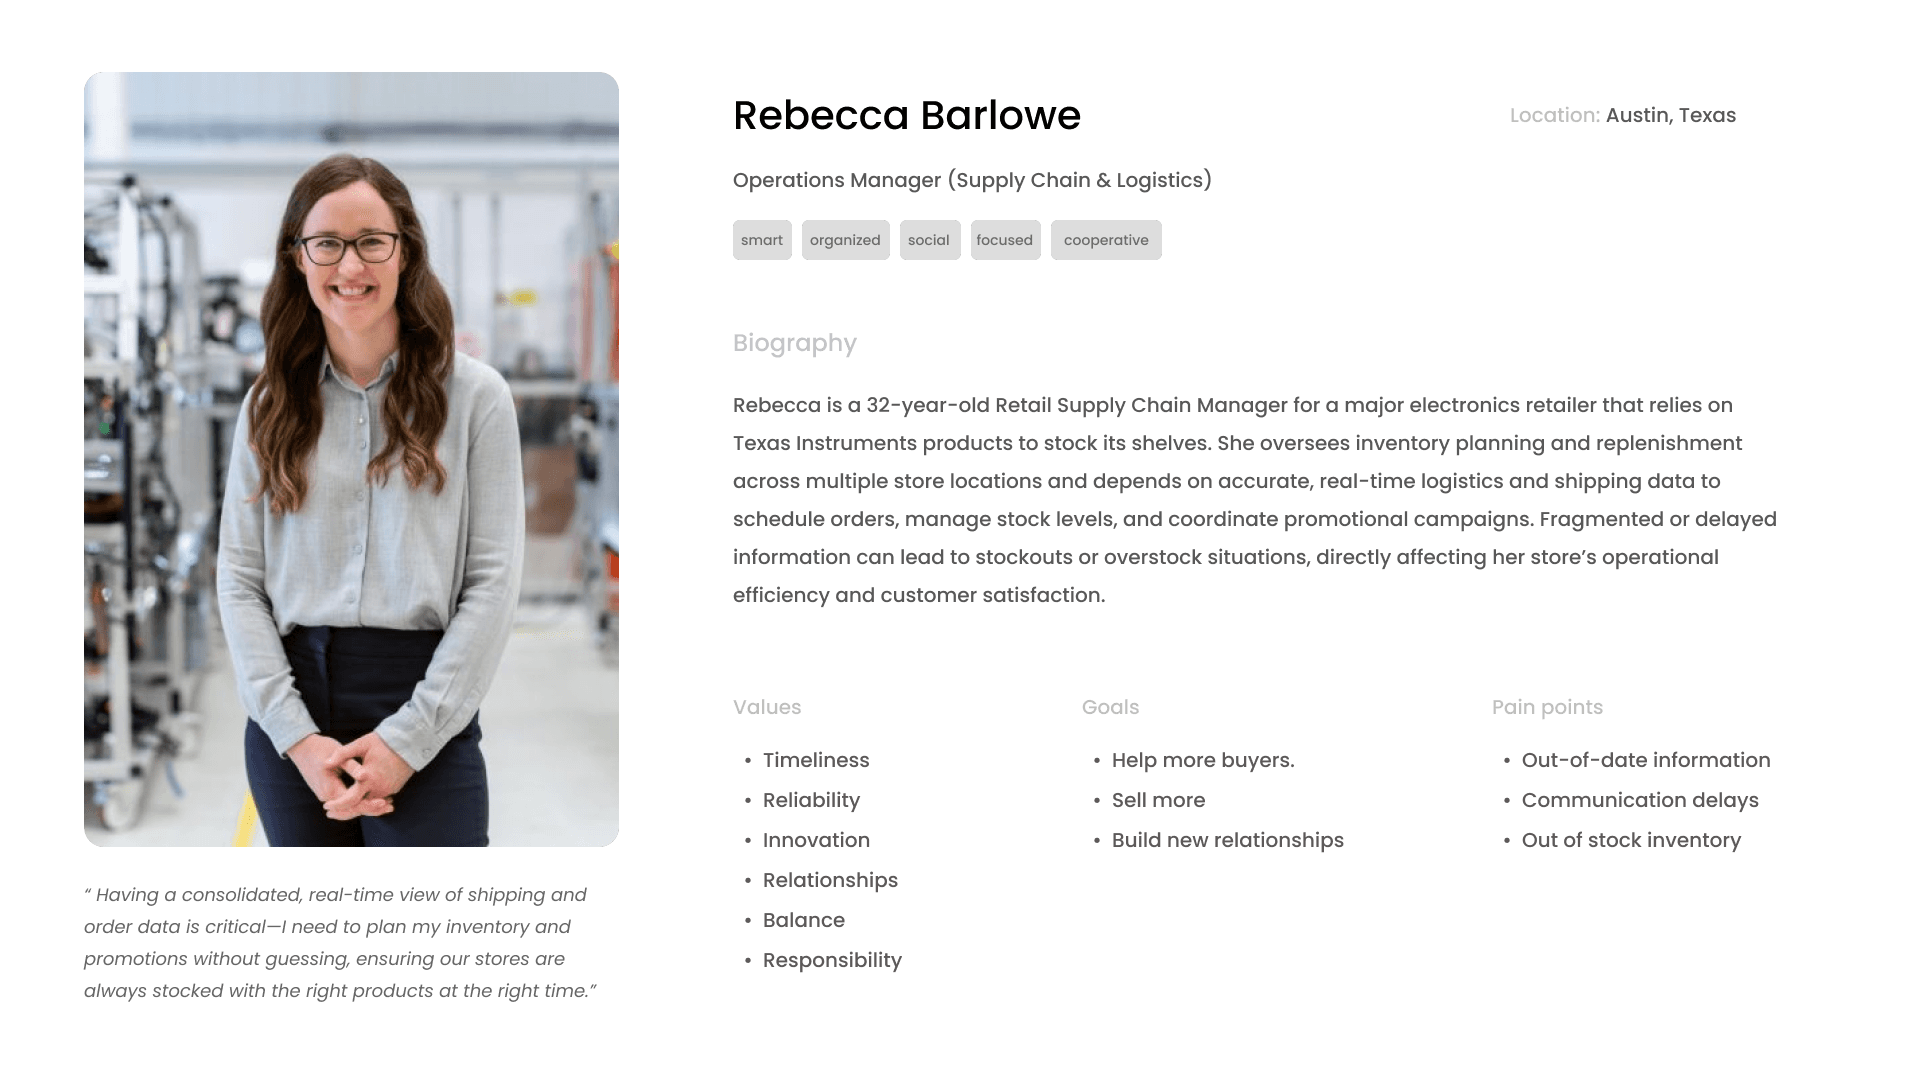
User persona 2
User persona 2
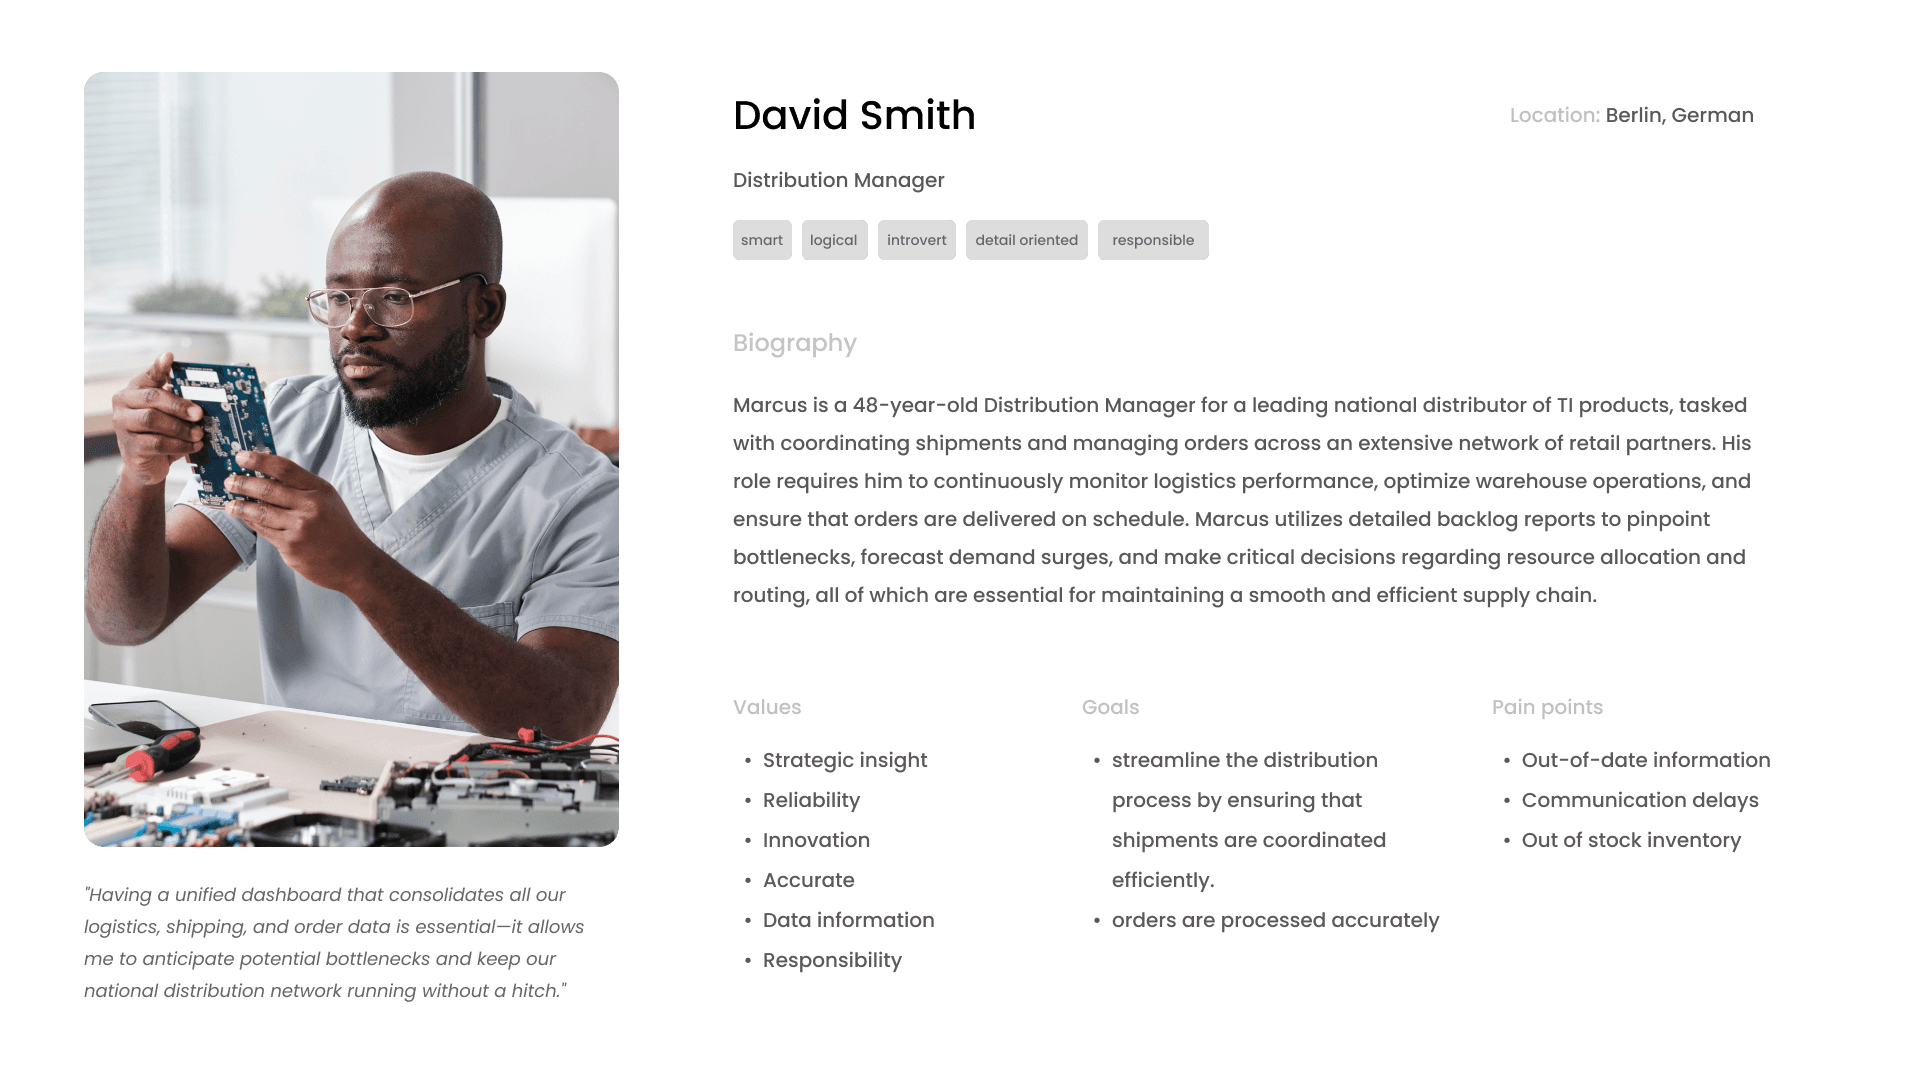

INSIGHT #1
In user surveys, 85% of participants indicated that real-time backlog reporting enabled them to make faster decisions—reducing their decision-making time by an average of 40%.
INSIGHT #1
In user surveys, 85% of participants indicated that real-time backlog reporting enabled them to make faster decisions—reducing their decision-making time by an average of 40%.
INSIGHT #2
Data showed that 78% of users experienced a 50% reduction in the time required to generate reports, allowing them to focus more on strategic tasks rather than administrative overhead.

INSIGHT #3
More than 70% of users indicated that the in-depth analysis from the backlog reports aided them in recognizing and tackling urgent problems early on, subsequently leading to a 30% reduction in unexpected operational interruptions.
INSIGHT #2
Data showed that 78% of users experienced a 50% reduction in the time required to generate reports, allowing them to focus more on strategic tasks rather than administrative overhead.
UI Design & Solutions
The UI design focuses on transforming complex logistics and order data into a streamlined, user-friendly experience. The core challenge was to present vast amounts of information—ranging from shipping statuses to order details
In a way that is both intuitive and actionable. To address this, we implemented a clean, dashboard-centric layout with modular components, allowing users to quickly access key metrics, apply dynamic filters, and drill down into detailed reports without feeling overwhelmed.
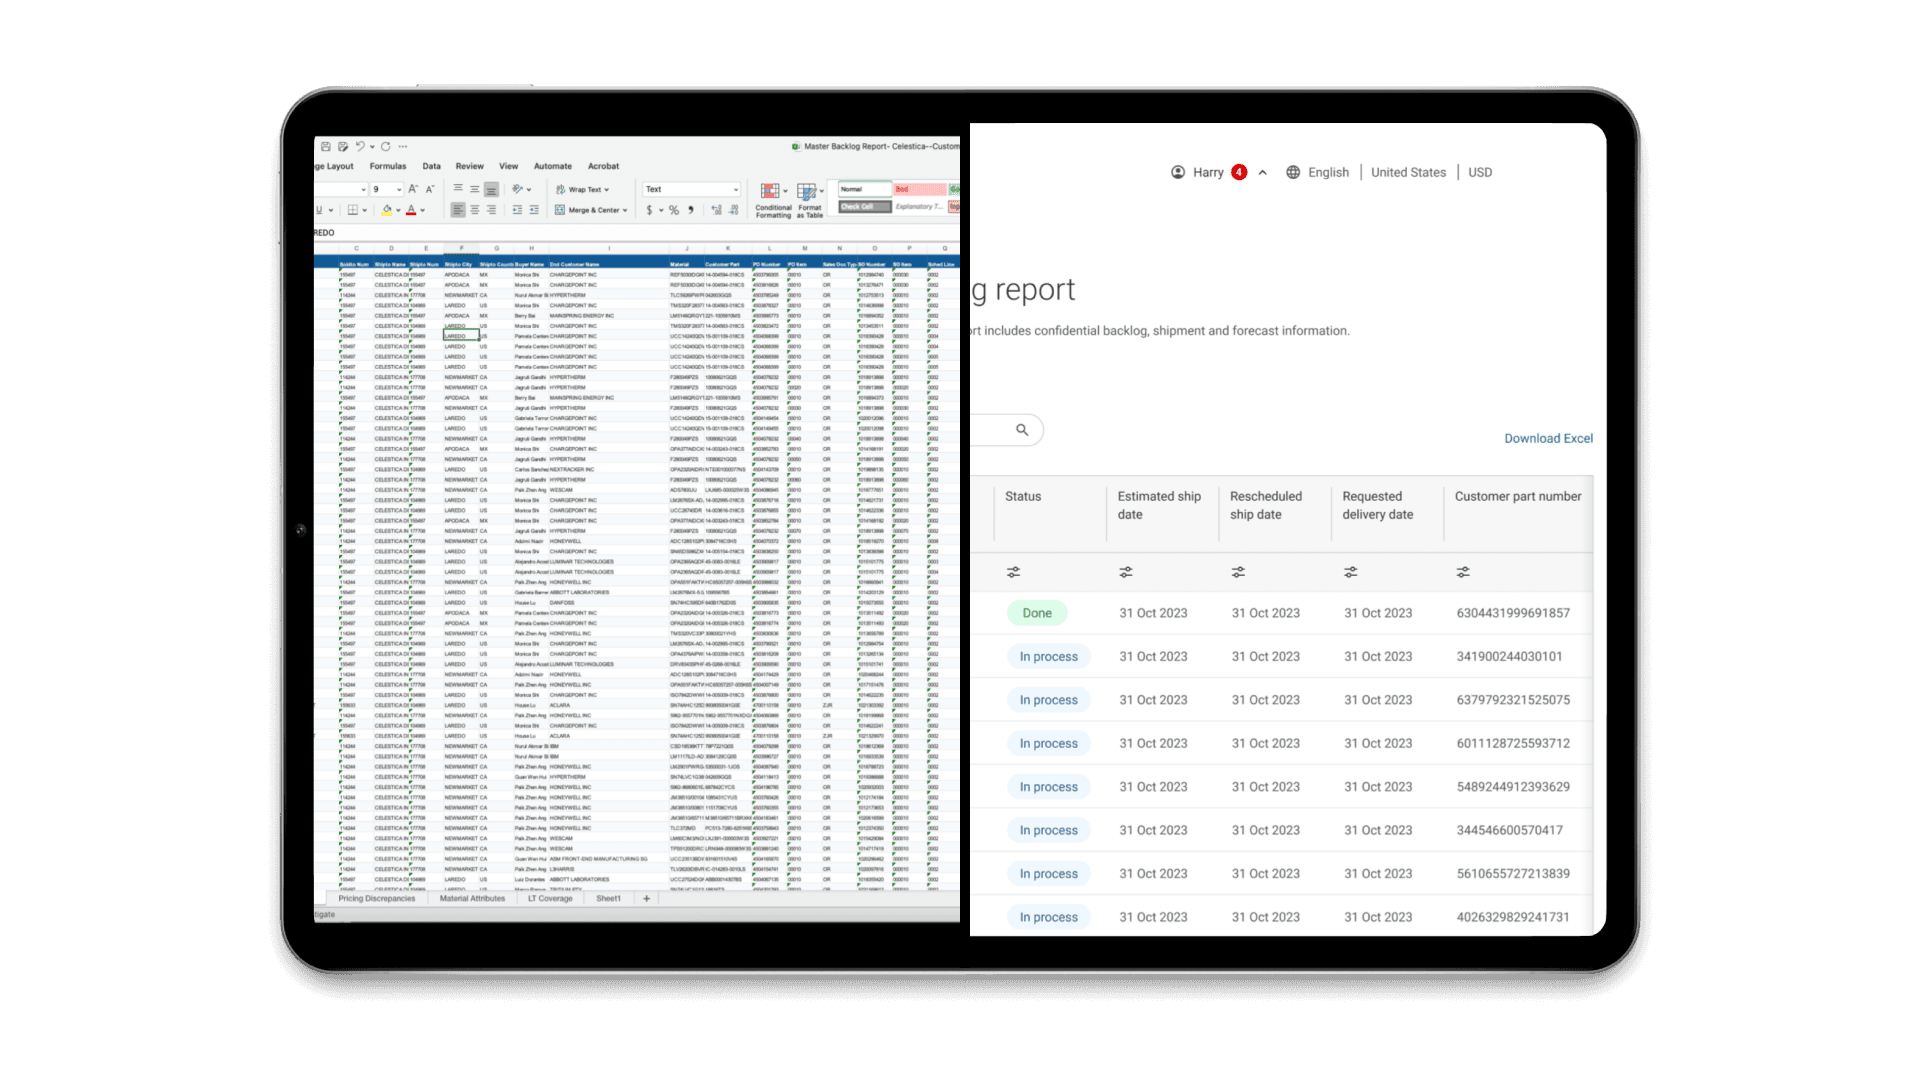
Image. Excel and online table comparison
INSIGHT #3
More than 70% of users indicated that the in-depth analysis from the backlog reports aided them in recognizing and tackling urgent problems early on, subsequently leading to a 30% reduction in unexpected operational interruptions.
05. Information Architecture
The structural design of the Backlog Report Self-Service System aims to enhance data reachability, increase user-friendly navigation, and facilitate effective decision-making processes. The report is accessible to clients through their dashboard.

06. Wireframing
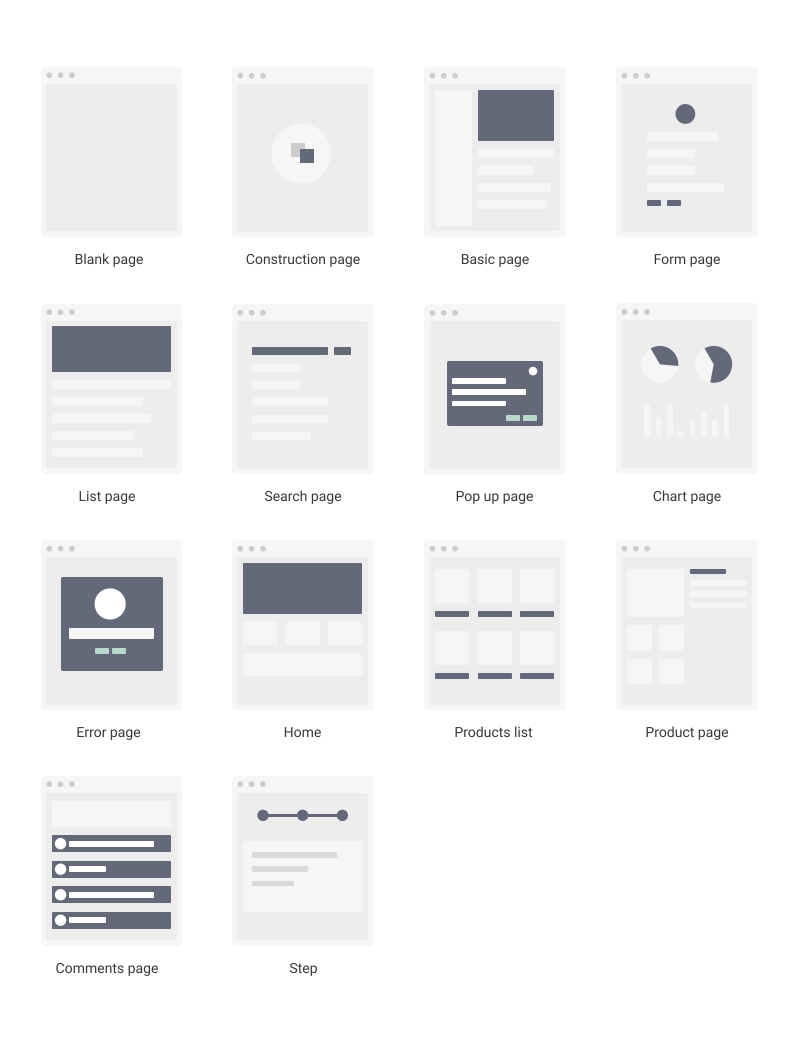
We developed interactive wireframes and prototypes, conducting multiple rounds of usability tests with target users. Feedback from these sessions informed refinements in navigation, visual hierarchy, and data visualization techniques. Key improvements included simplified workflows, clearer data presentations, and more robust filtering mechanisms.
Designer
Designer
Stakeholders
07. Visual design (UI)
The UI design focuses on transforming complex logistics and order data into a streamlined, user-friendly experience. The core challenge was to present vast amounts of information—ranging from shipping statuses to order details
In a way that is both intuitive and actionable. To address this, we implemented a clean, dashboard-centric layout with modular components, allowing users to quickly access key metrics, apply dynamic filters, and drill down into detailed reports without feeling overwhelmed.
08. Design system & TI Polaris
The UI design focuses on transforming complex logistics and order data into a streamlined, user-friendly experience. The core challenge was to present vast amounts of information—ranging from shipping statuses to order details
Image. Excel and online table comparison
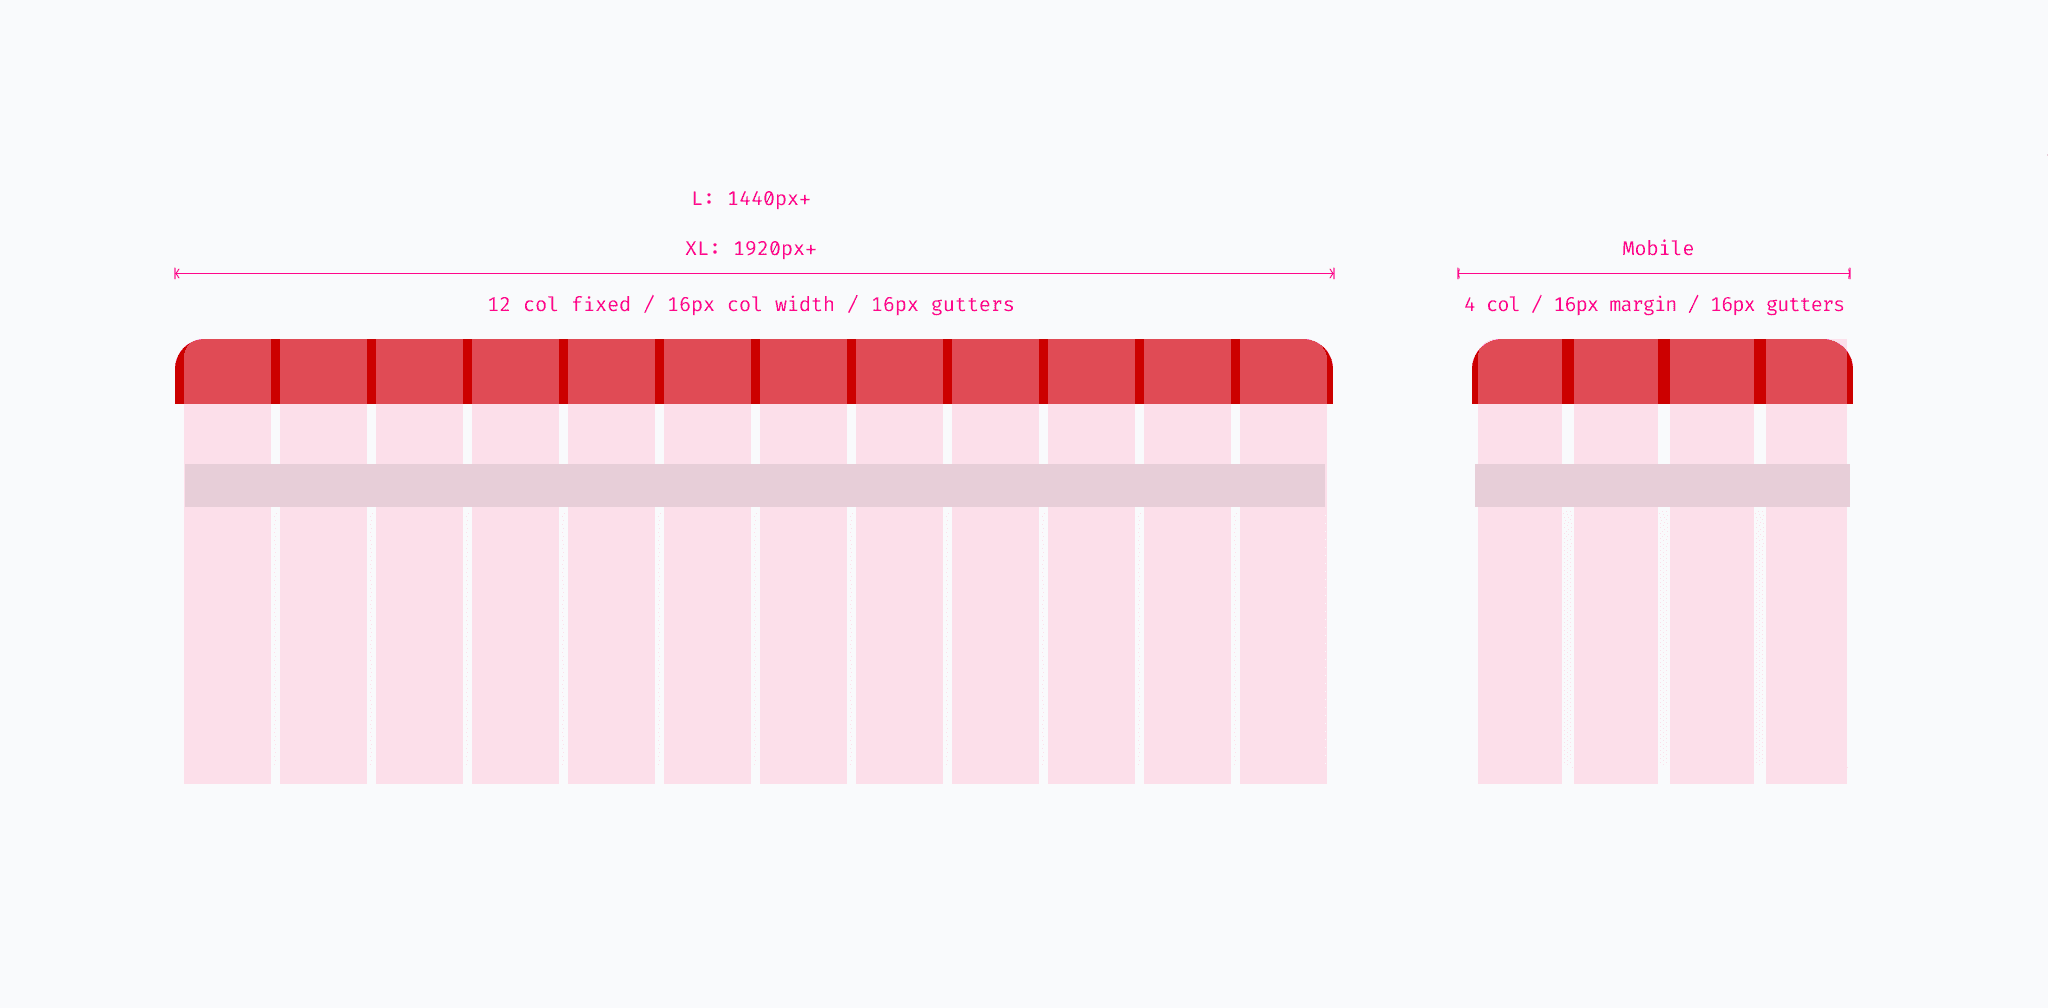
Design system & TI Polaris
The UI design focuses on transforming complex logistics and order data into a streamlined, user-friendly experience. The core challenge was to present vast amounts of information—ranging from shipping statuses to order details
Image. Excel and online table comparison
Design system & TI Polaris
The UI design focuses on transforming complex logistics and order data into a streamlined, user-friendly experience. The core challenge was to present vast amounts of information—ranging from shipping statuses to order details
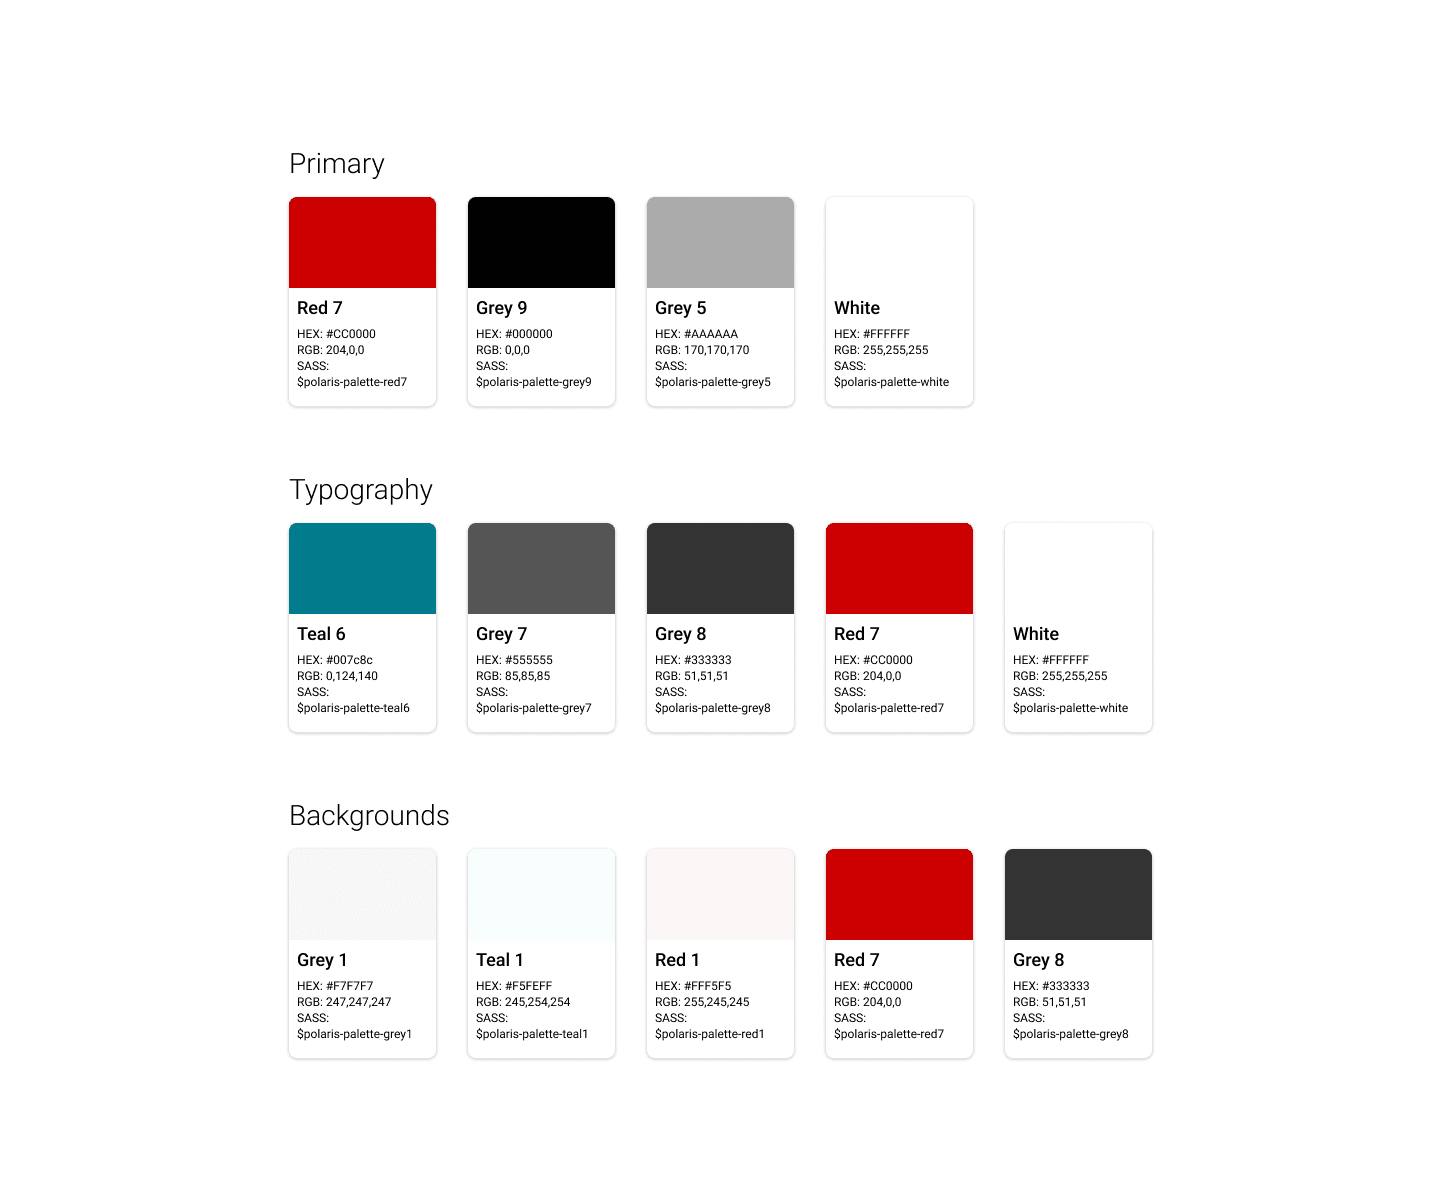
Wireframing
We developed interactive wireframes and prototypes, conducting multiple rounds of usability tests with target users. Feedback from these sessions informed refinements in navigation, visual hierarchy, and data visualization techniques. Key improvements included simplified workflows, clearer data presentations, and more robust filtering mechanisms.
Designer
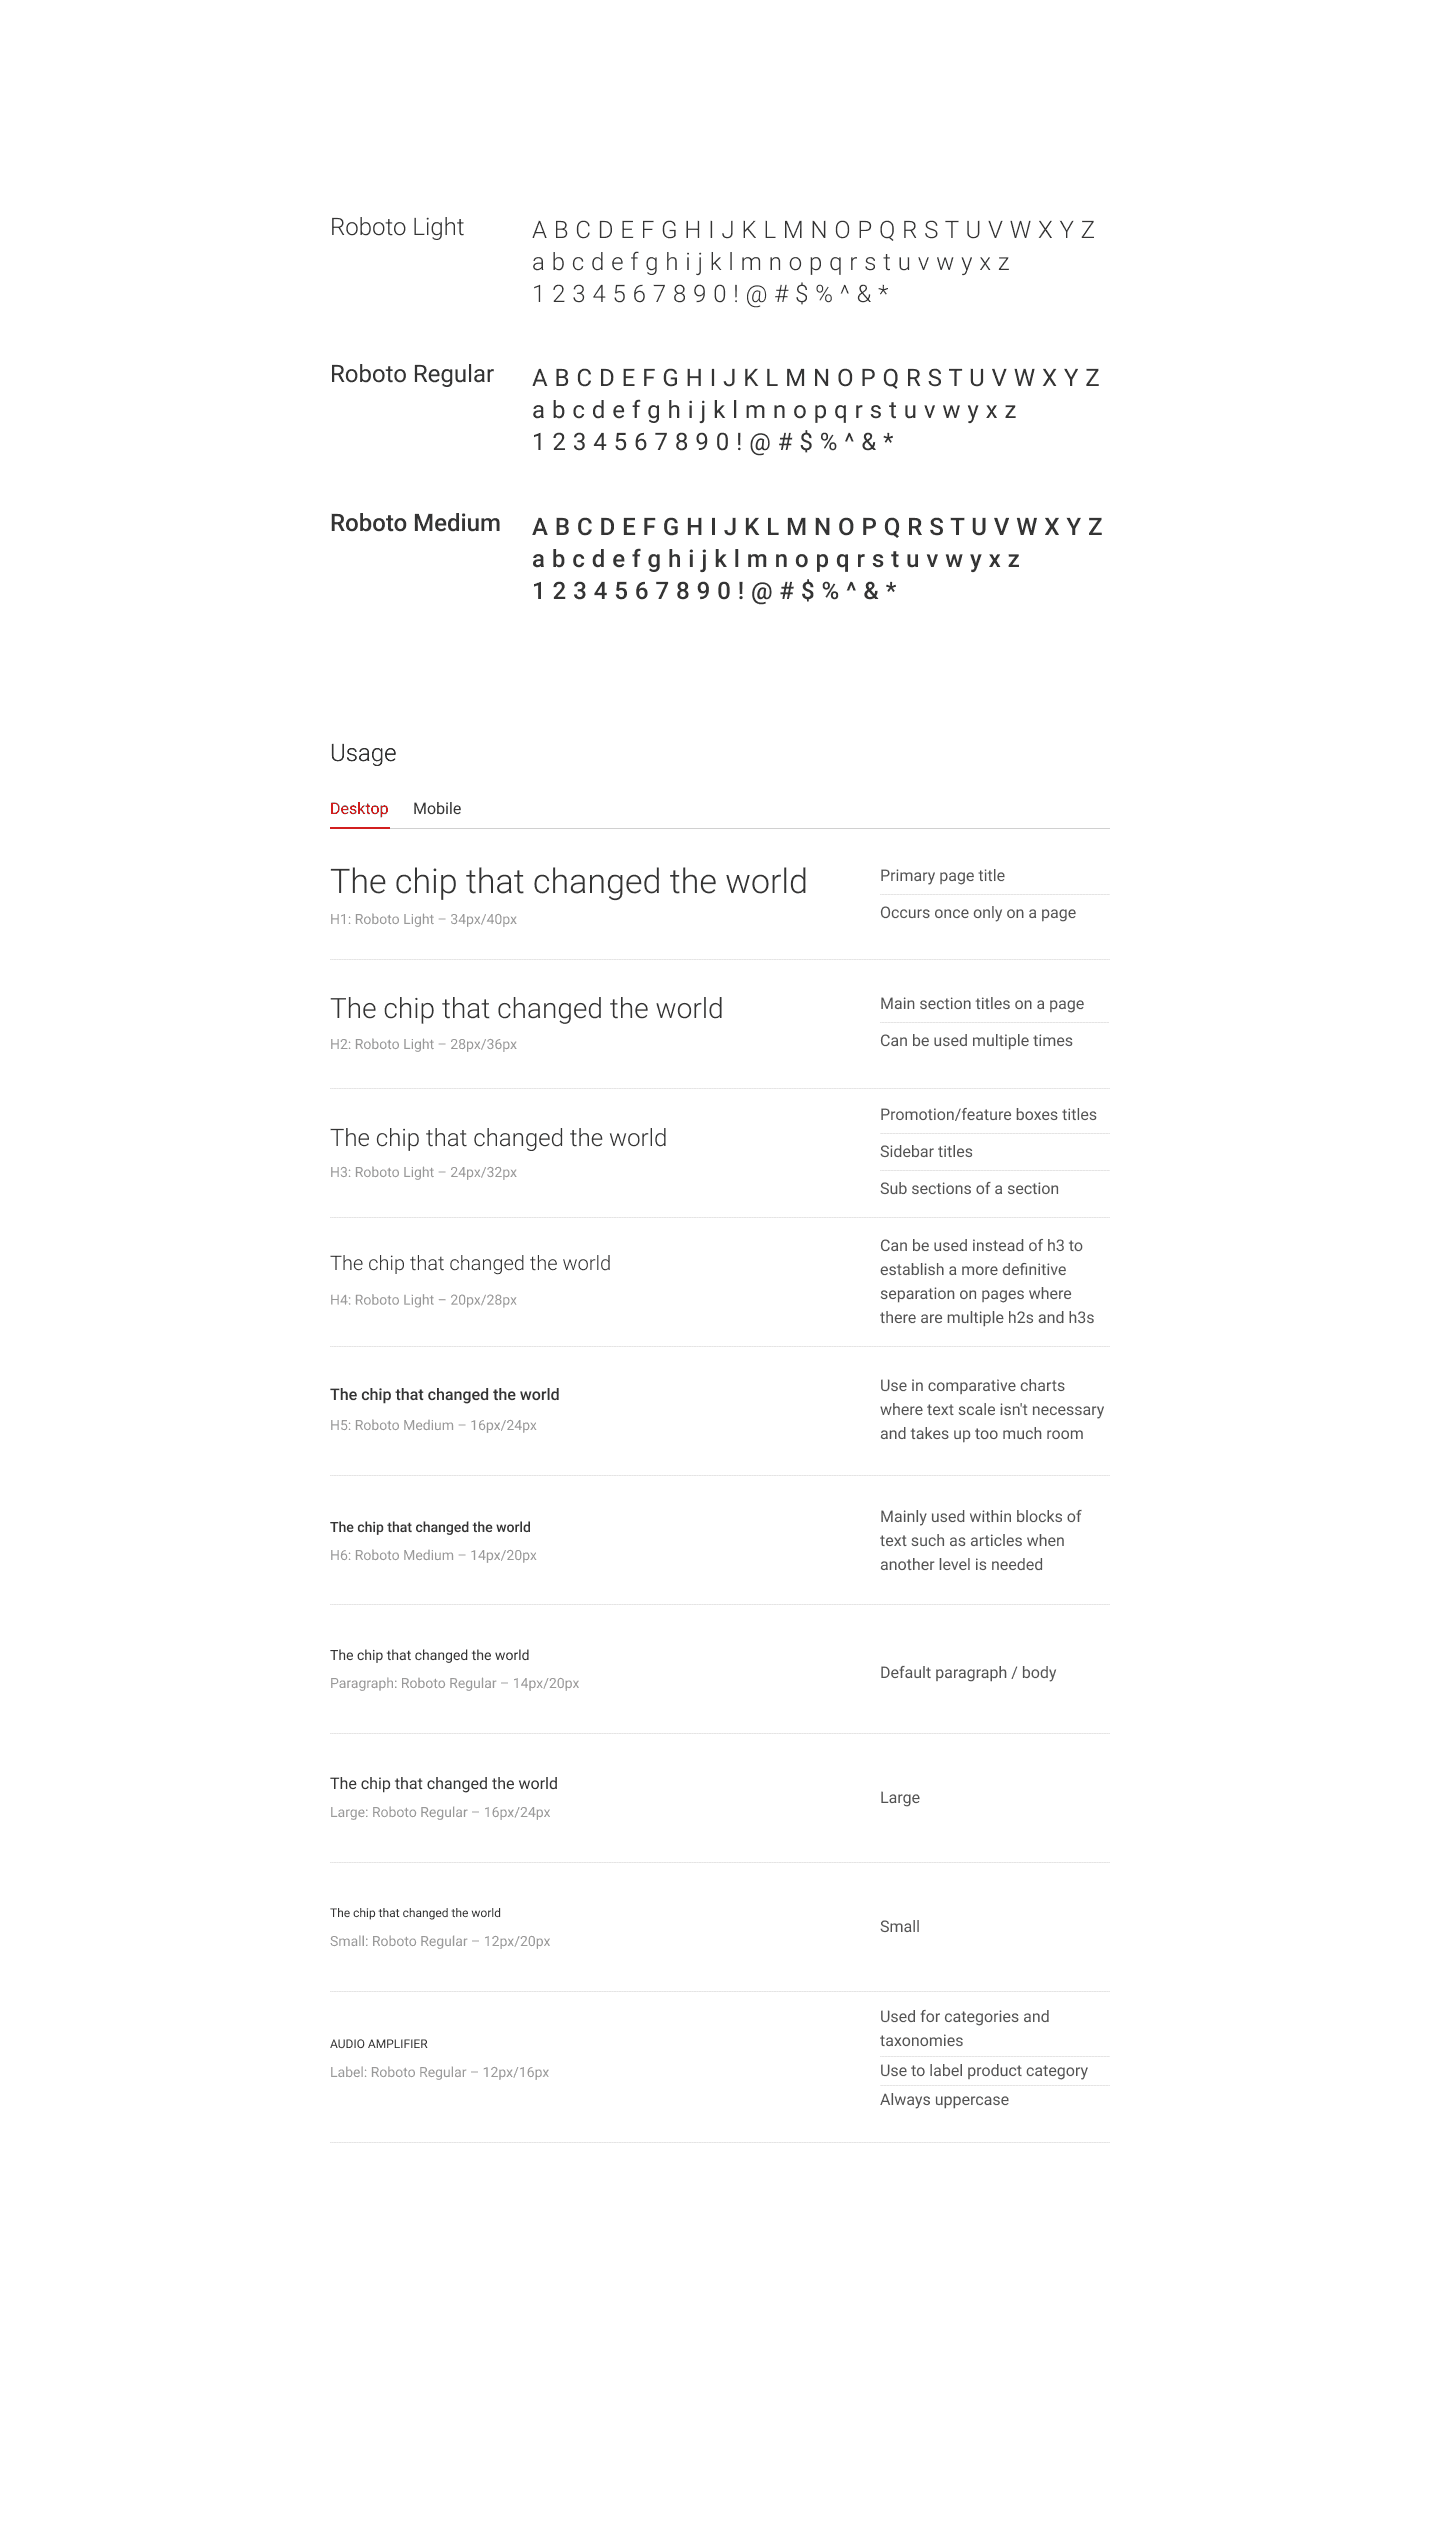
Typography
The UI design focuses on transforming complex logistics and order data into a streamlined, user-friendly experience. The core challenge was to present vast amounts of information—ranging from shipping statuses to order details
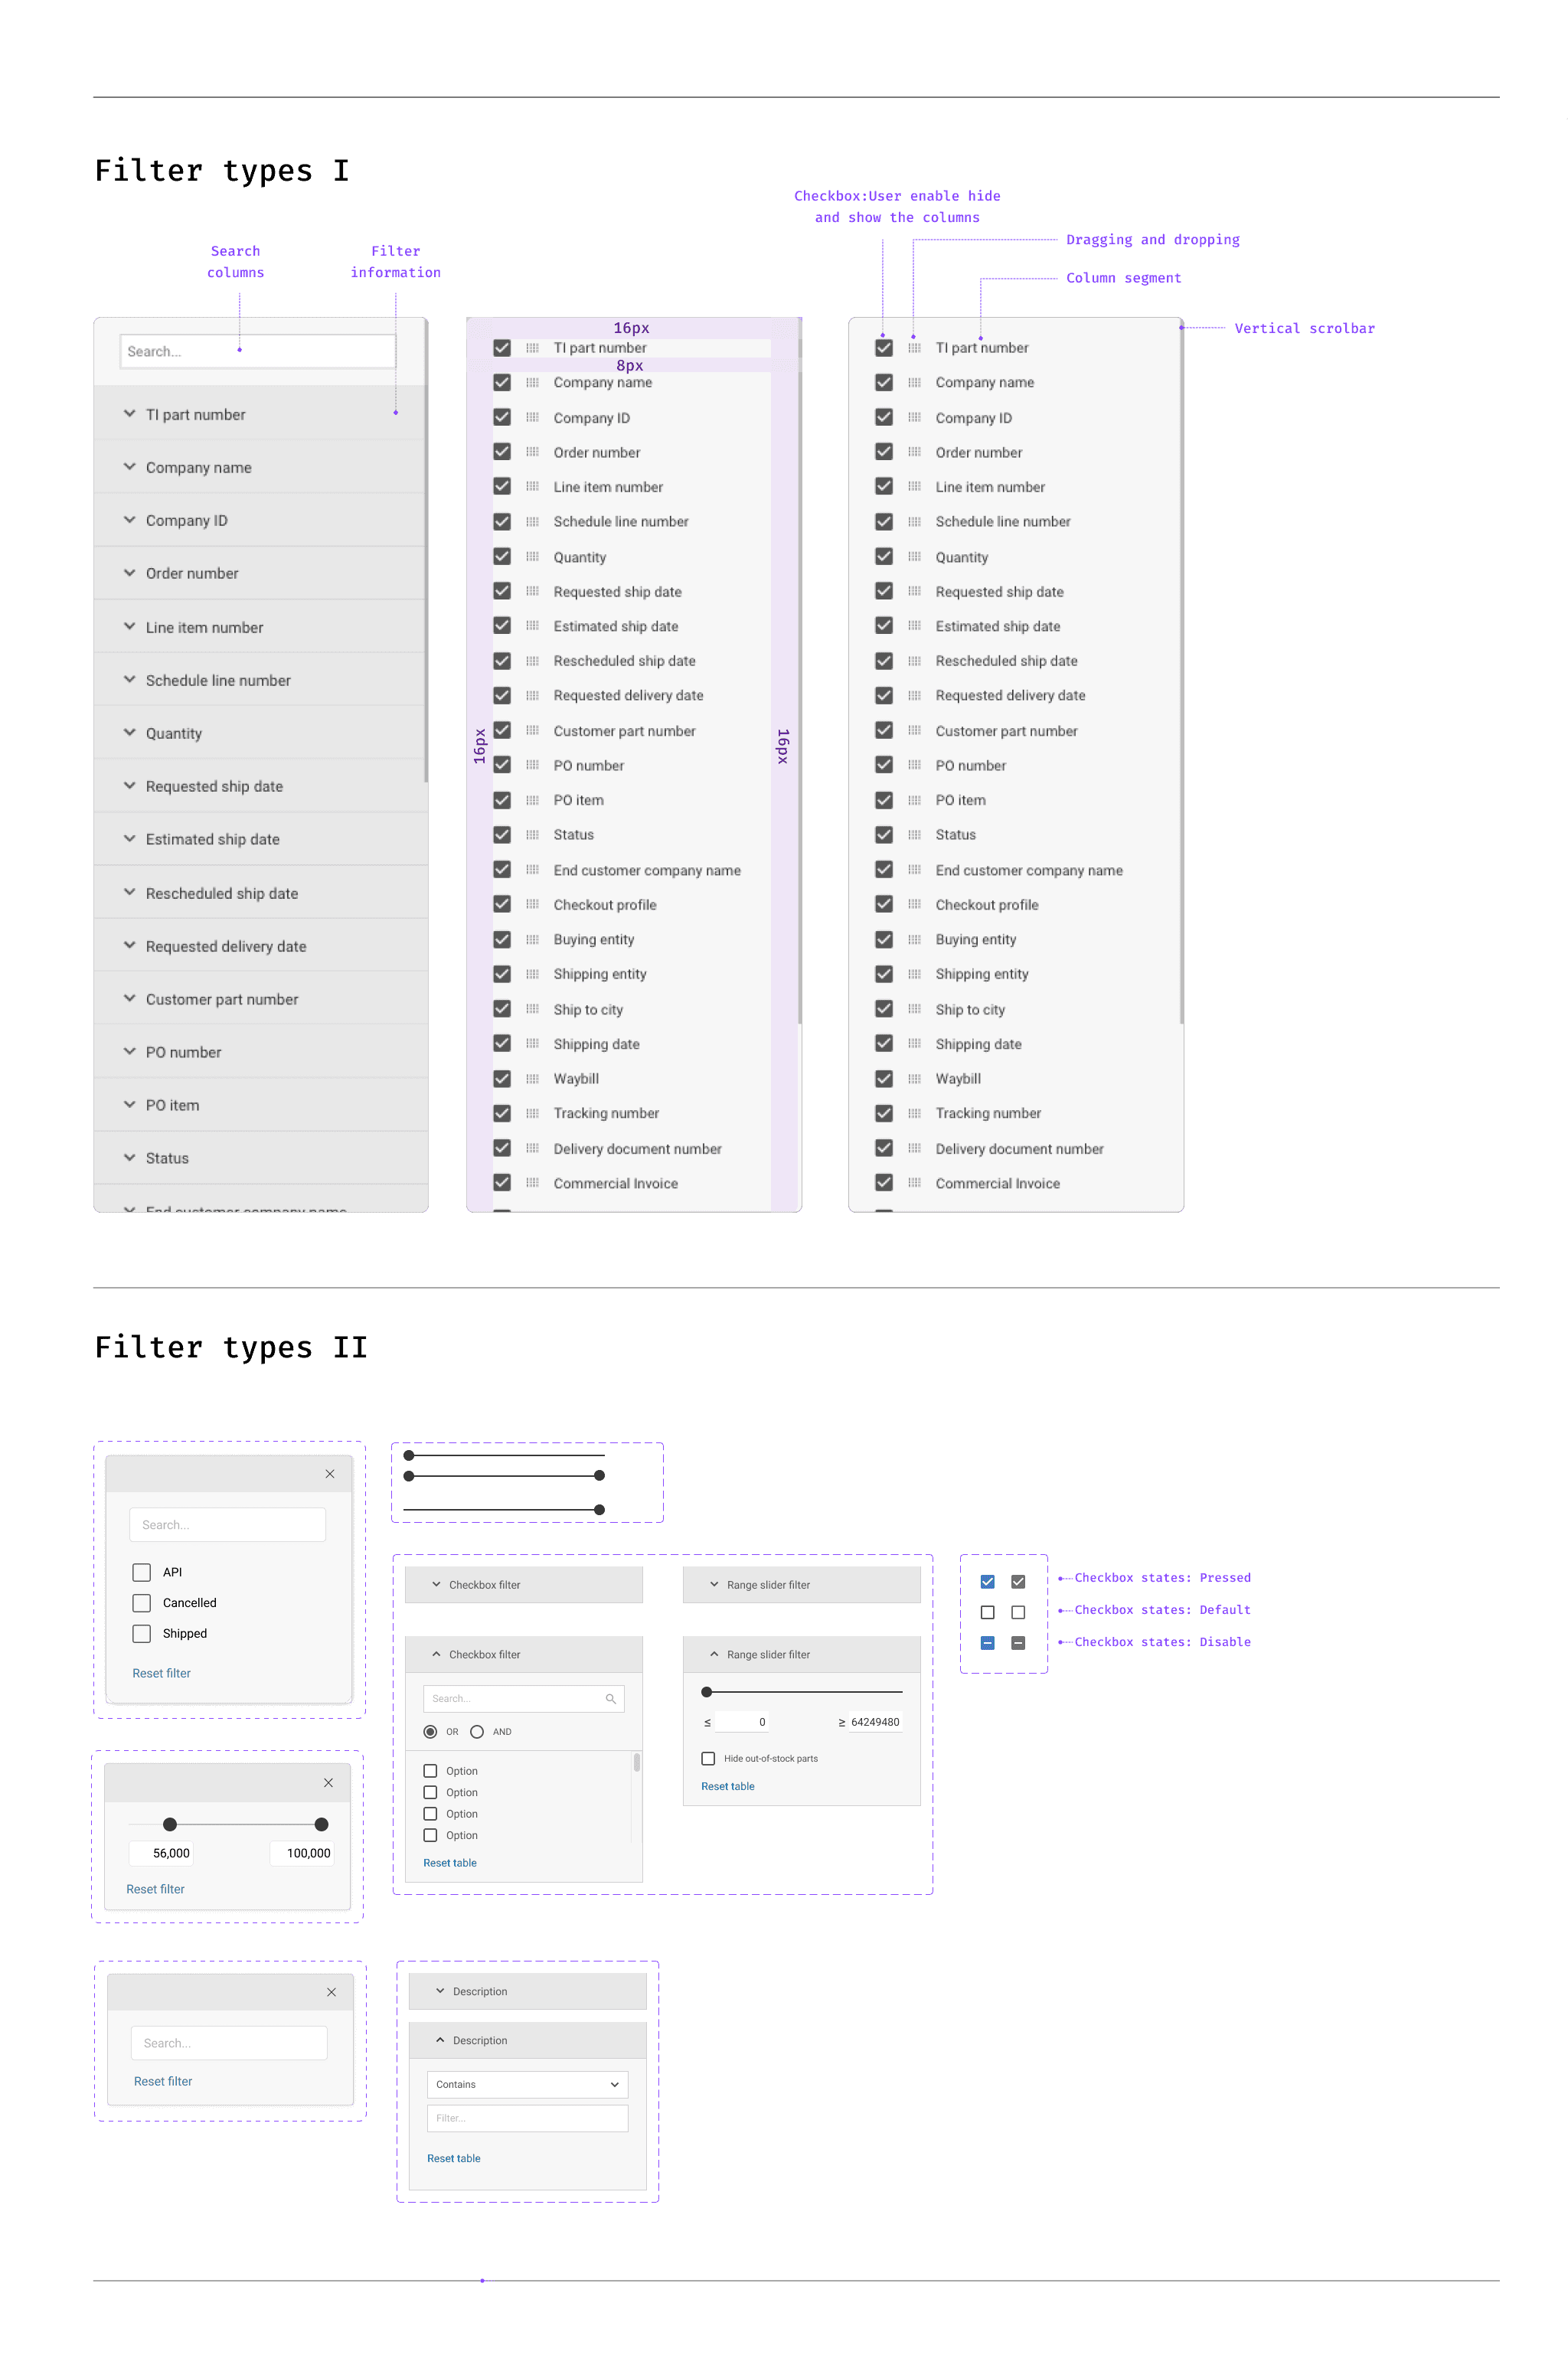
09. UI Components
09. UI Components
The UI design focuses on transforming complex logistics and order data into a streamlined, user-friendly experience. The core challenge was to present vast amounts of information—ranging from shipping statuses to order details
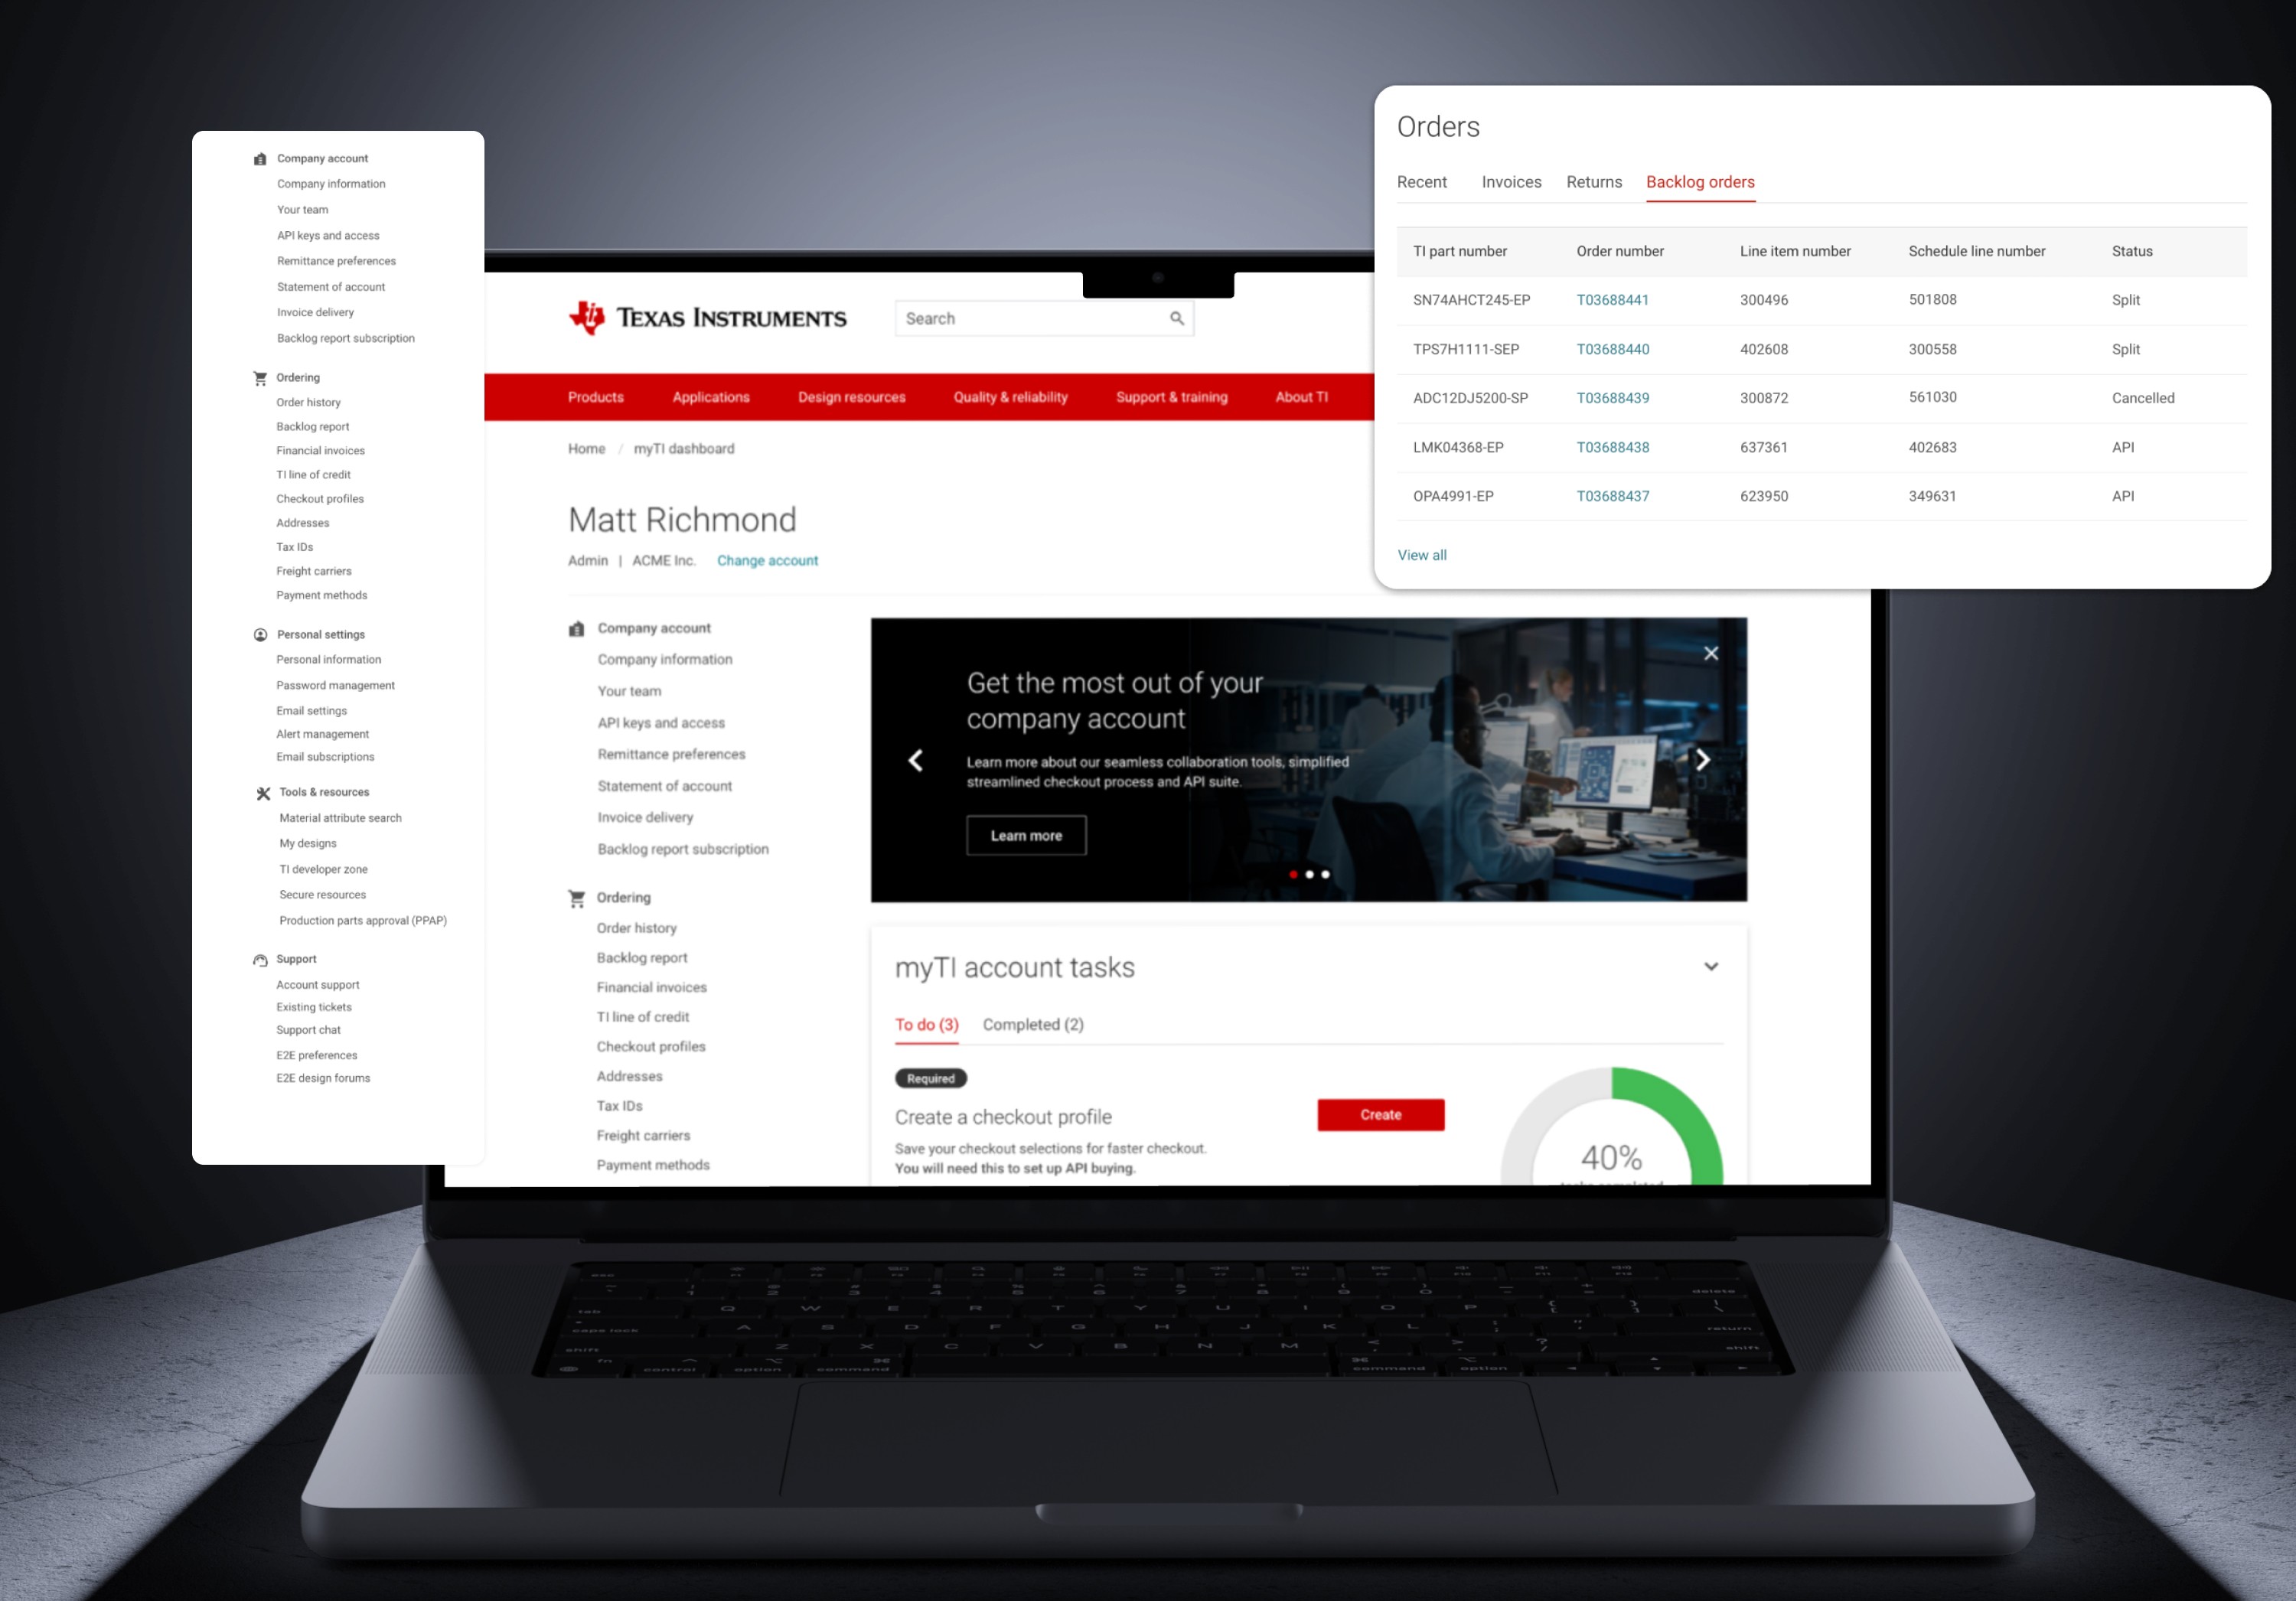
11. User Access from their dashboard
11. User Access from their dashboard
The UI design focuses on transforming complex logistics and order data into a streamlined, user-friendly experience. The core challenge was to present vast amounts of information—ranging from shipping statuses to order details
The UI design focuses on transforming complex logistics and order data into a streamlined, user-friendly experience. The core challenge was to present vast amounts of information—ranging from shipping statuses to order details
12. Design solutions
12. Design solutions
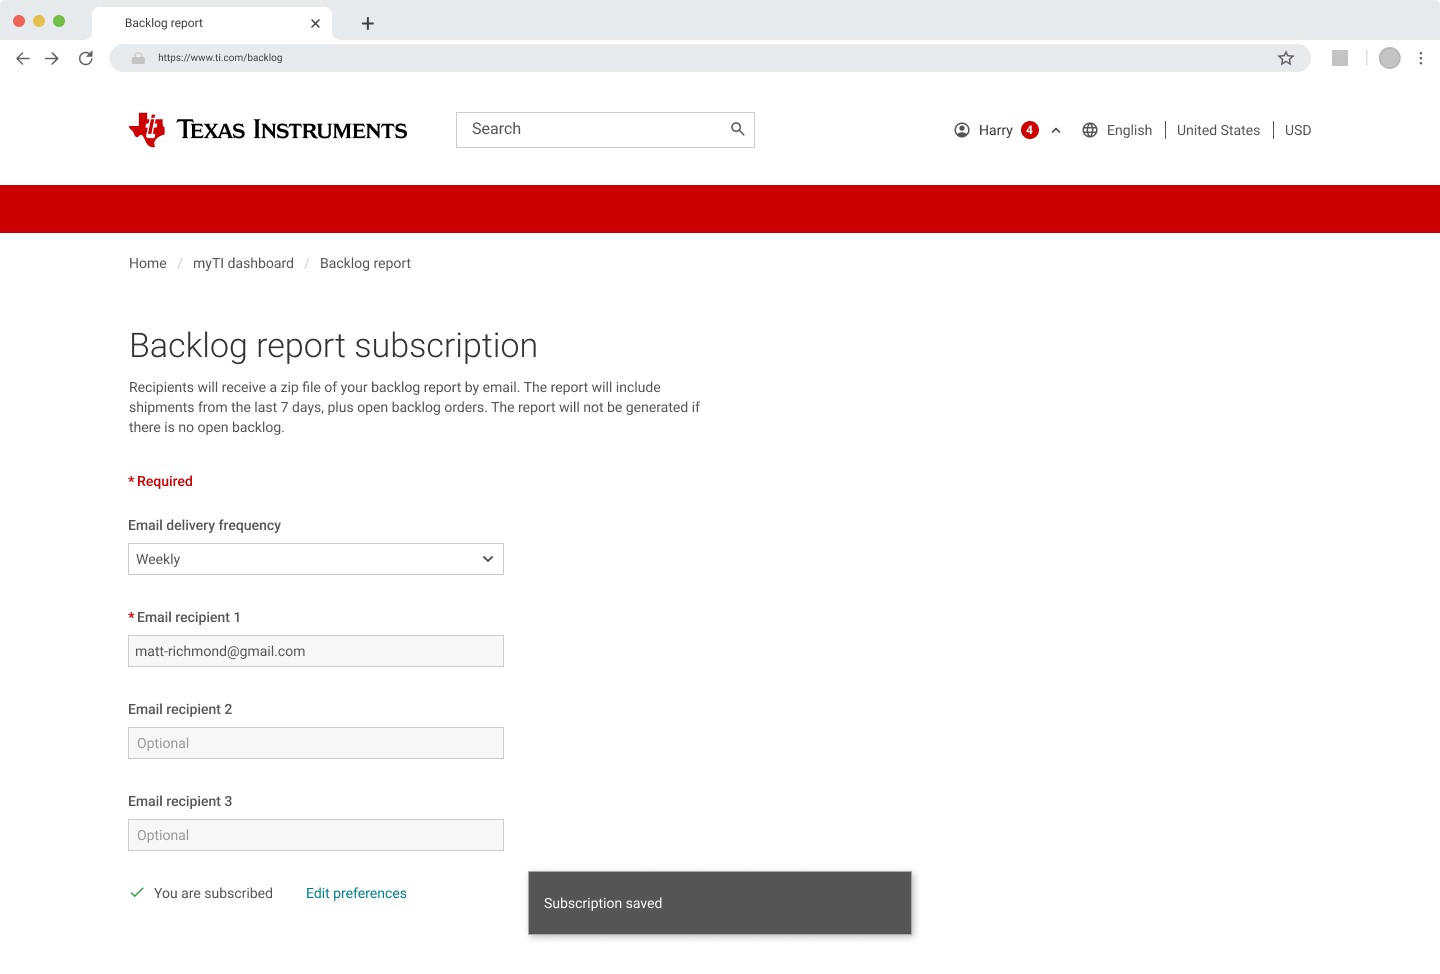
12.1 Subscription-Based Backlog Report for Users
To enhance efficiency and reduce the need for manual report retrieval, we implemented a subscription-based backlog report feature, allowing users to automate the report delivery process based on their preferences. This feature ensures that customers and internal stakeholders receive timely, relevant, and customized backlog updates without having to log in manually to check their order status.
Users can choose the frequency of report delivery:
Daily
Weekly
Bi-weekly
Monthly
To enhance efficiency and reduce the need for manual report retrieval, we implemented a subscription-based backlog report feature, allowing users to automate the report delivery process based on their preferences. This feature ensures that customers and internal stakeholders receive timely, relevant, and customized backlog updates without having to log in manually to check their order status.
Users can choose the frequency of report delivery:
Daily
Weekly
Bi-weekly
Monthly
Design solutions
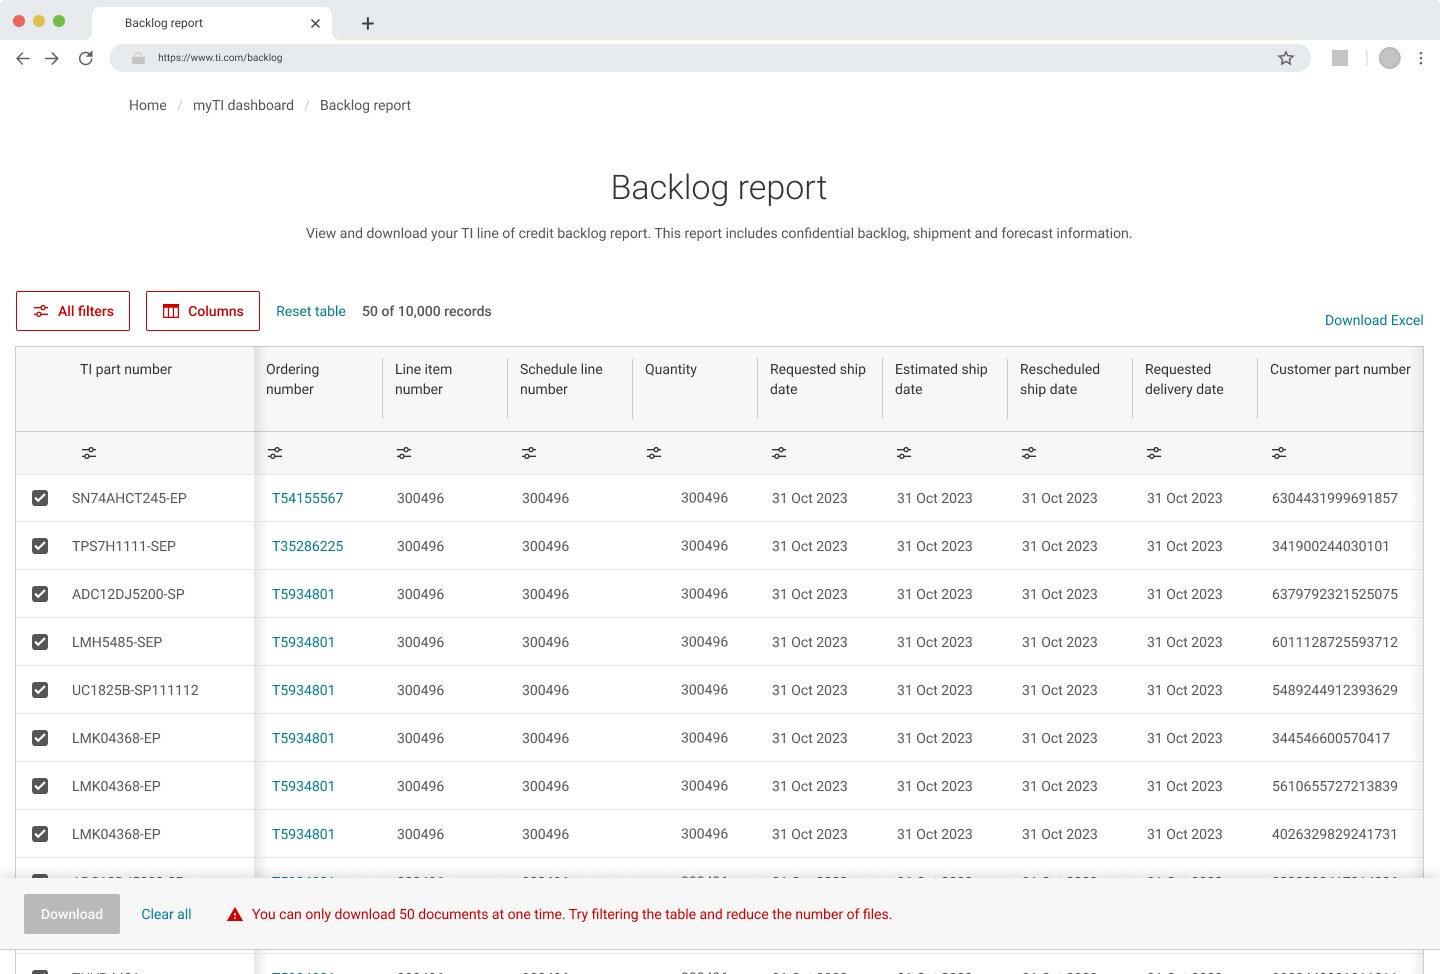
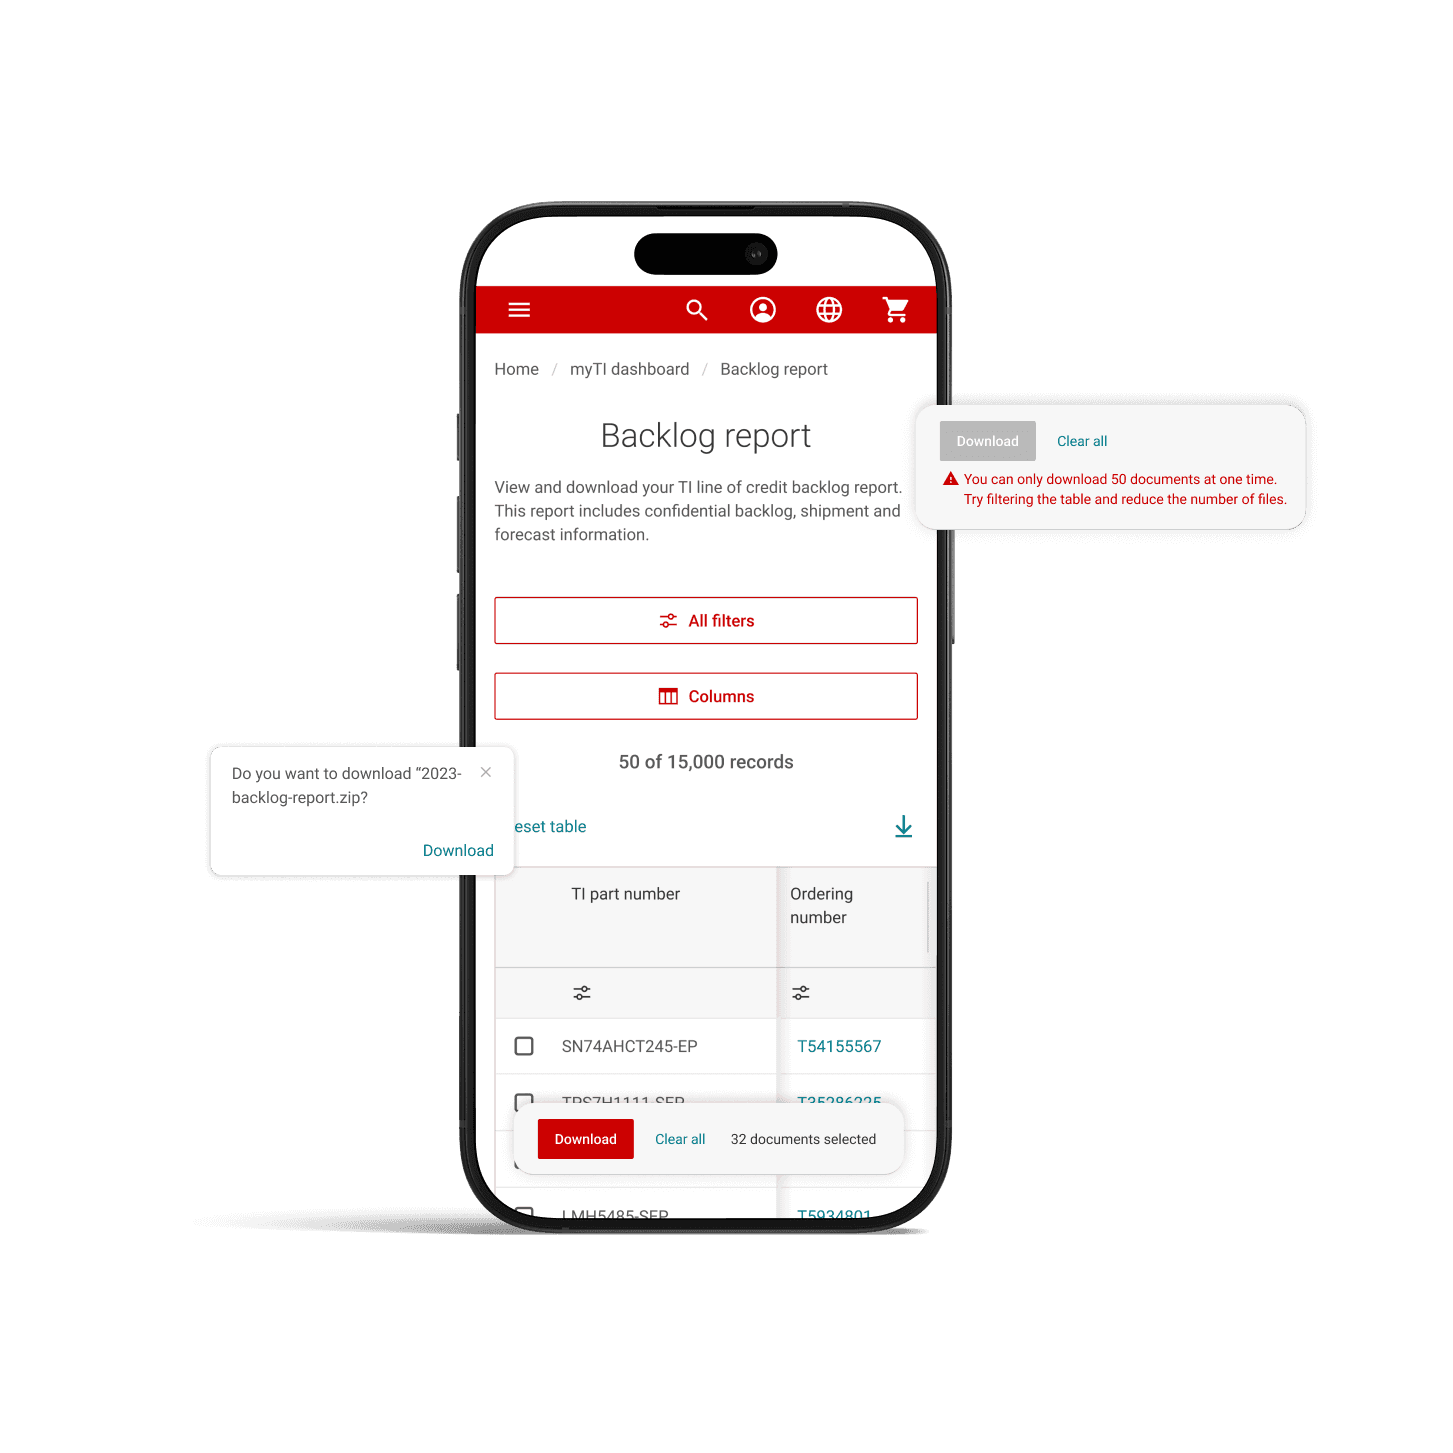
12.2 Limited Document Download Control for Backlog Reports
To enhance data security, prevent misuse, and optimize system performance, the backlog report system introduces a controlled document download feature. This ensures that users can access critical backlog data while maintaining compliance with business policies and IT security guidelines.
12. Design solutions
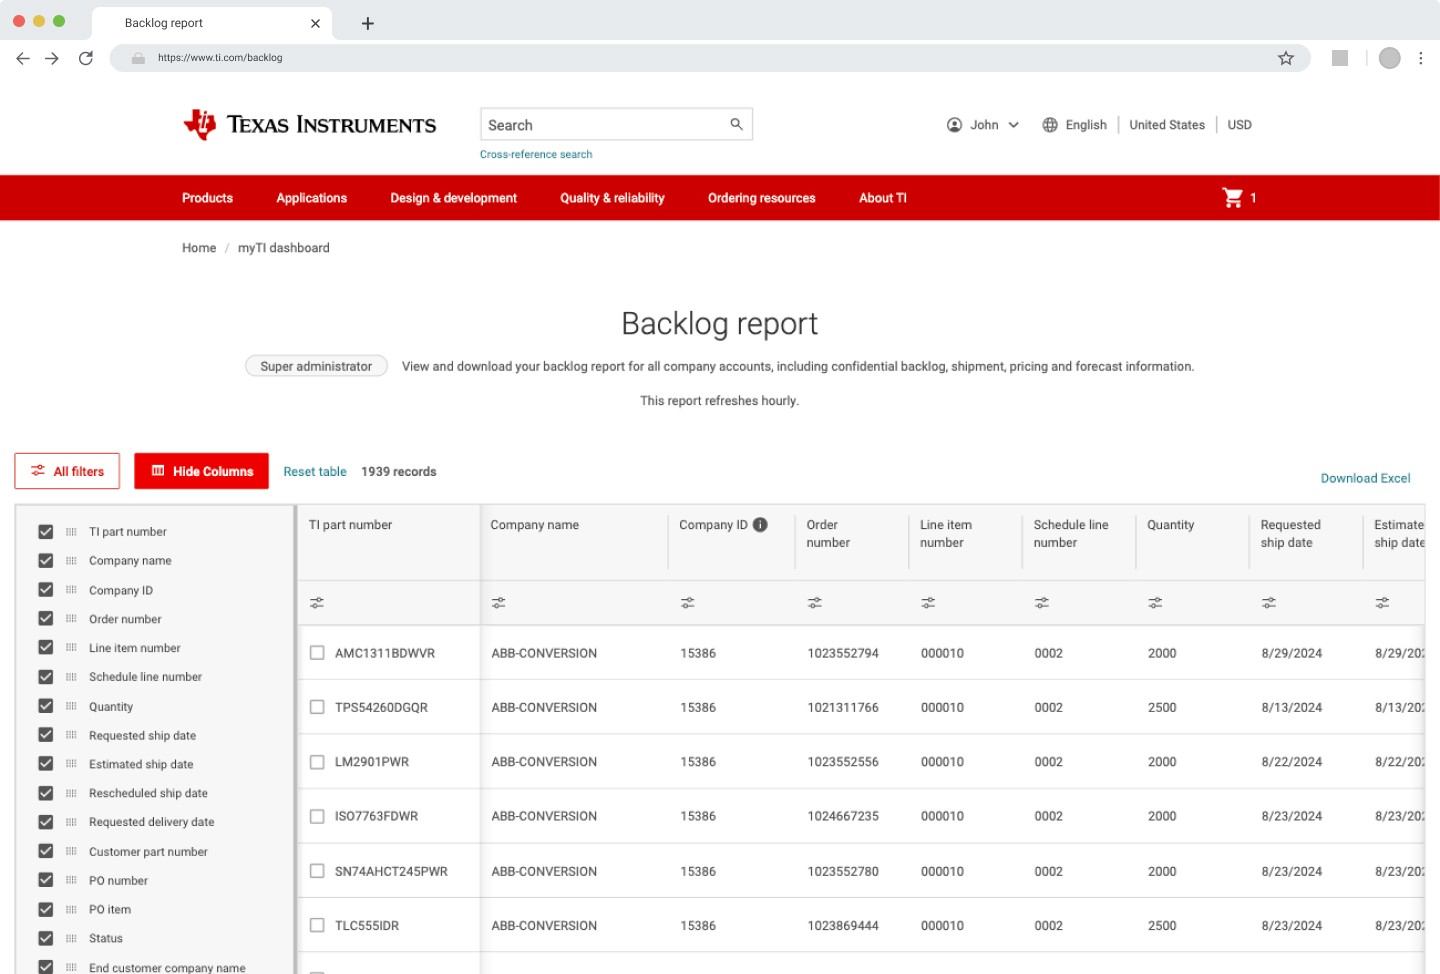
12.3 Users can prioritize their columns
The backlog report system includes a column prioritization feature, allowing users to customize their data view based on what’s most relevant to their workflow. Given that different users—such as supply chain managers, procurement teams, and logistics coordinators—have varying needs, this feature ensures they can see the most critical information first without unnecessary clutter.
The backlog report system includes a column prioritization feature, allowing users to customize their data view based on what’s most relevant to their workflow. Given that different users—such as supply chain managers, procurement teams, and logistics coordinators—have varying needs, this feature ensures they can see the most critical information first without unnecessary clutter.
Design solution 1.0
Browse dozens of professionally designed templates. Click, duplicate, customize.
Browse dozens of professionally designed templates. Click, duplicate, customize.
Design solutions
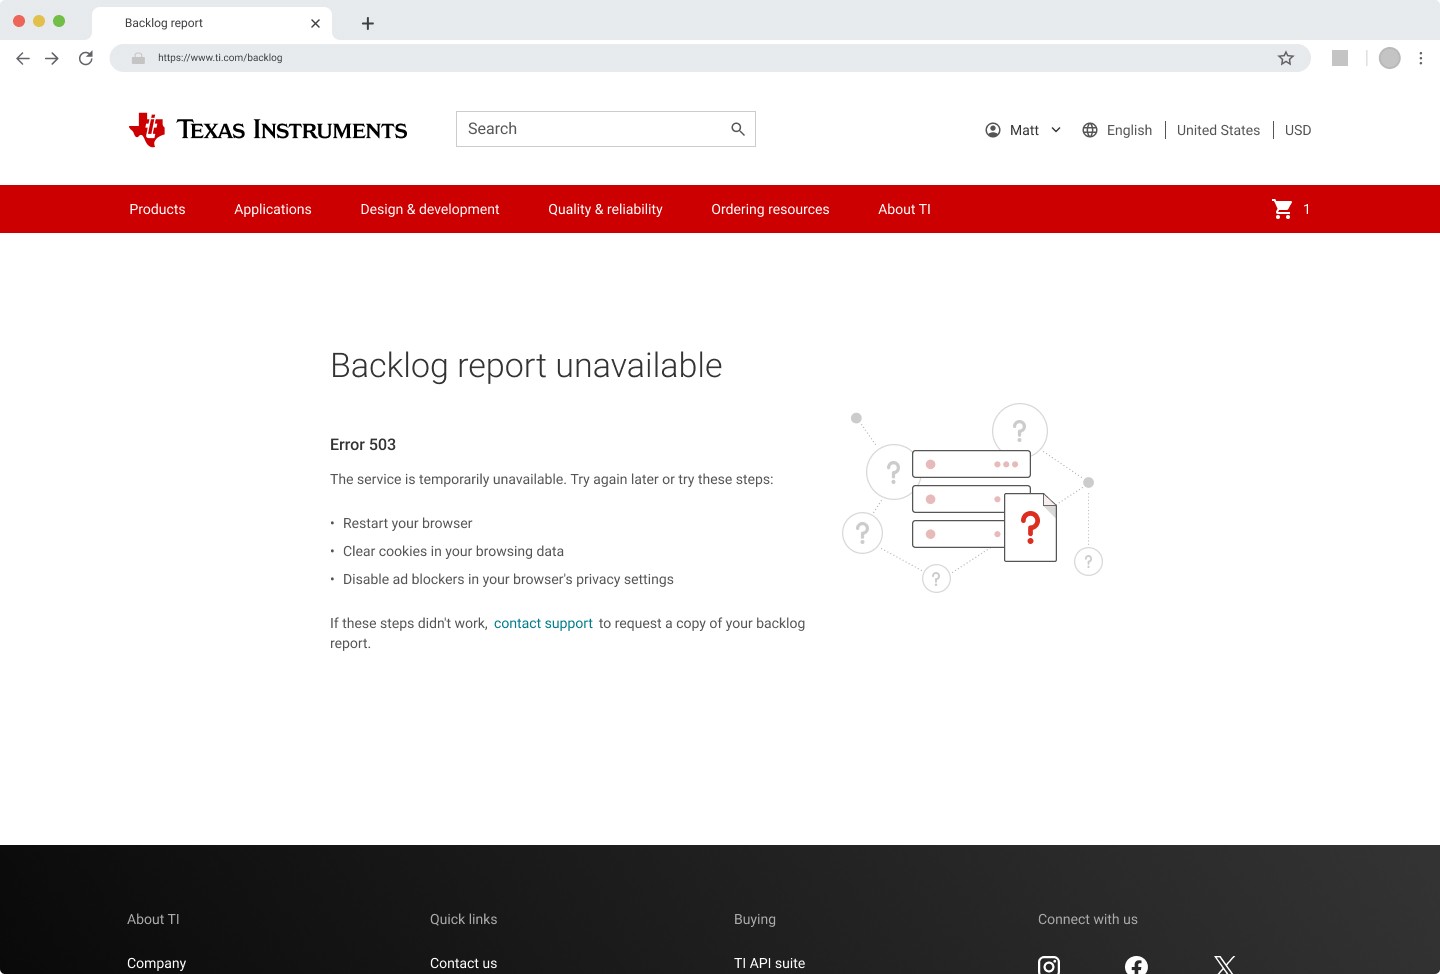
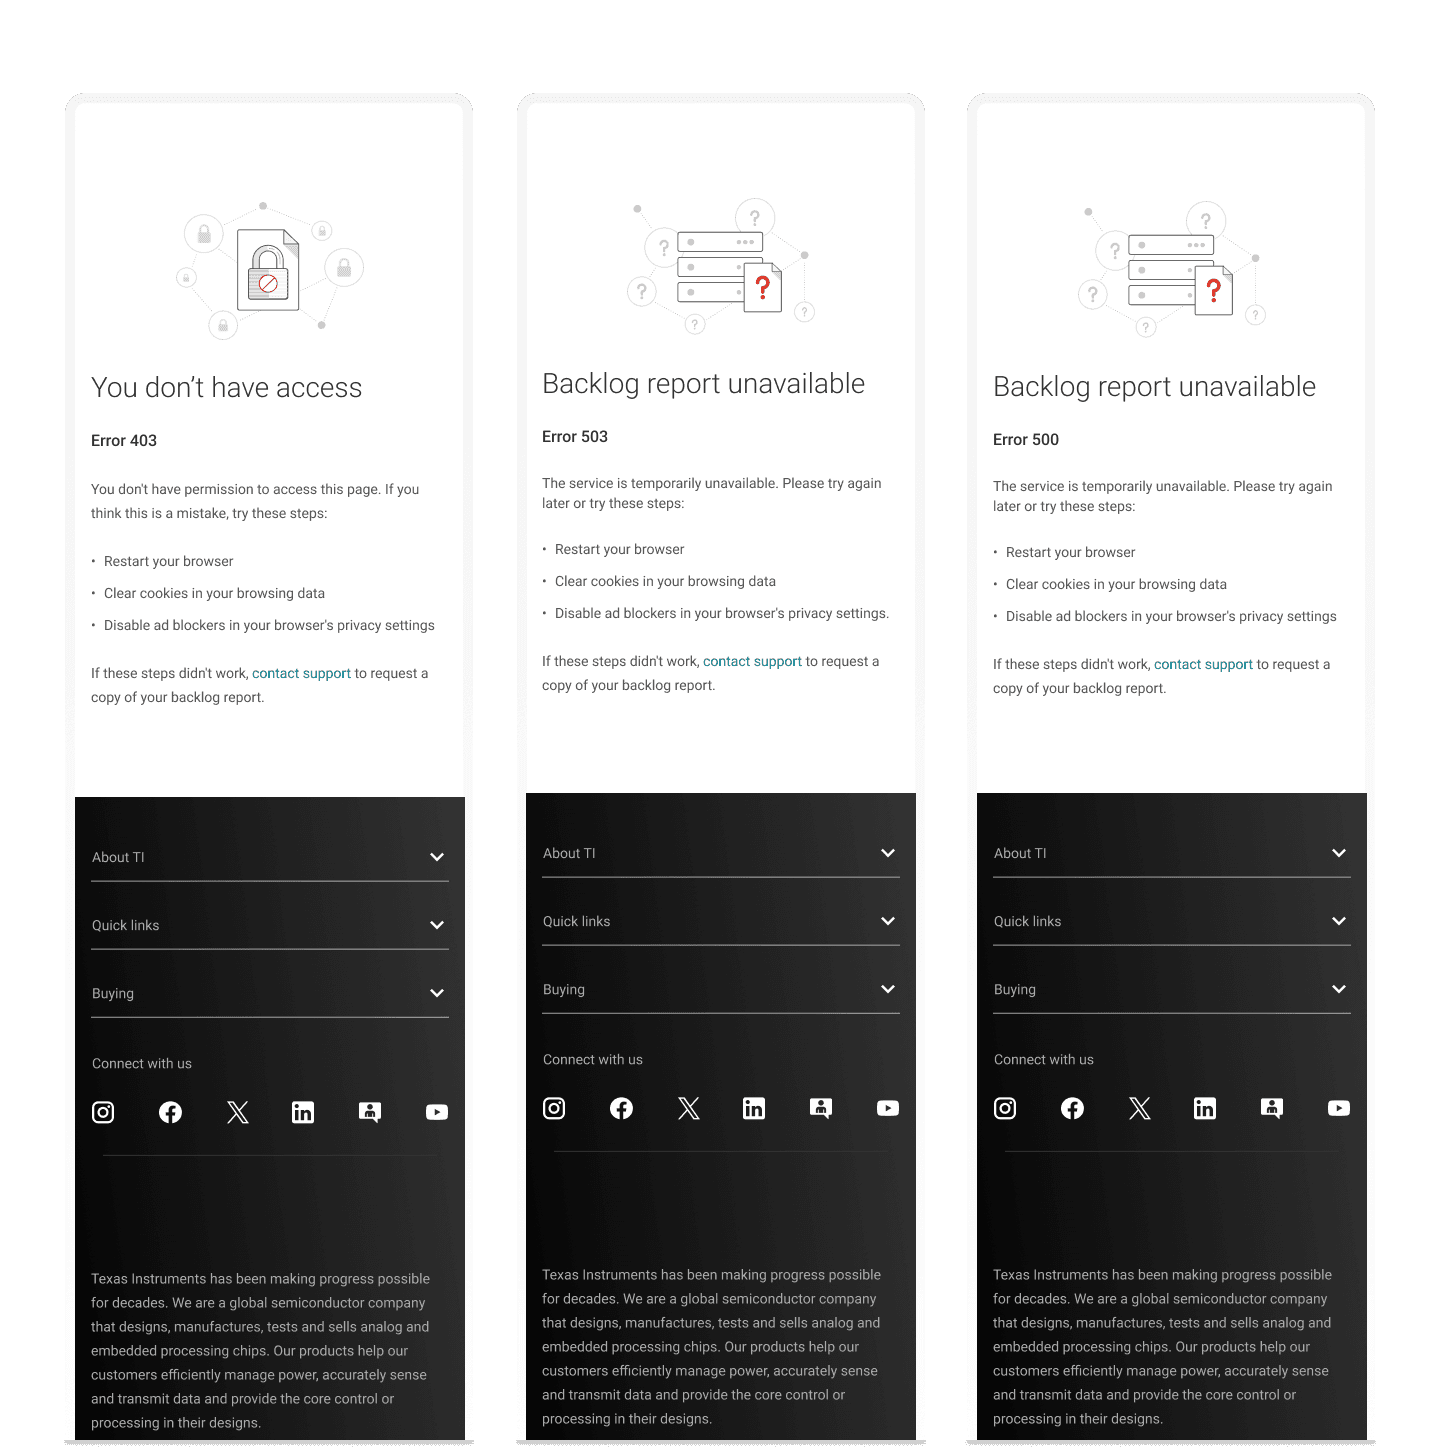
12.4 Error Pages for Backlog Report System
To improve user experience and provide clear, actionable guidance, the backlog report system includes well-designed error pages that help users troubleshoot issues efficiently. Instead of displaying generic error messages, the system offers customized explanations, solutions, and next steps to minimize frustration and support resolution.
403 Forbidden – Unauthorized Access
404 Not Found – Report or Page Missing
408 Request Timeout – Slow Server Response
500 Internal Server Error – System Malfunction
503 Service Unavailable – System Maintenance
Design solution 2.0
Browse dozens of professionally designed templates. Click, duplicate, customize.
Browse dozens of professionally designed templates. Click, duplicate, customize.
Design solution 2.0
Browse dozens of professionally designed templates. Click, duplicate, customize.
Browse dozens of professionally designed templates. Click, duplicate, customize.
Mobile designs
Browse dozens of professionally designed templates. Click, duplicate, customize.
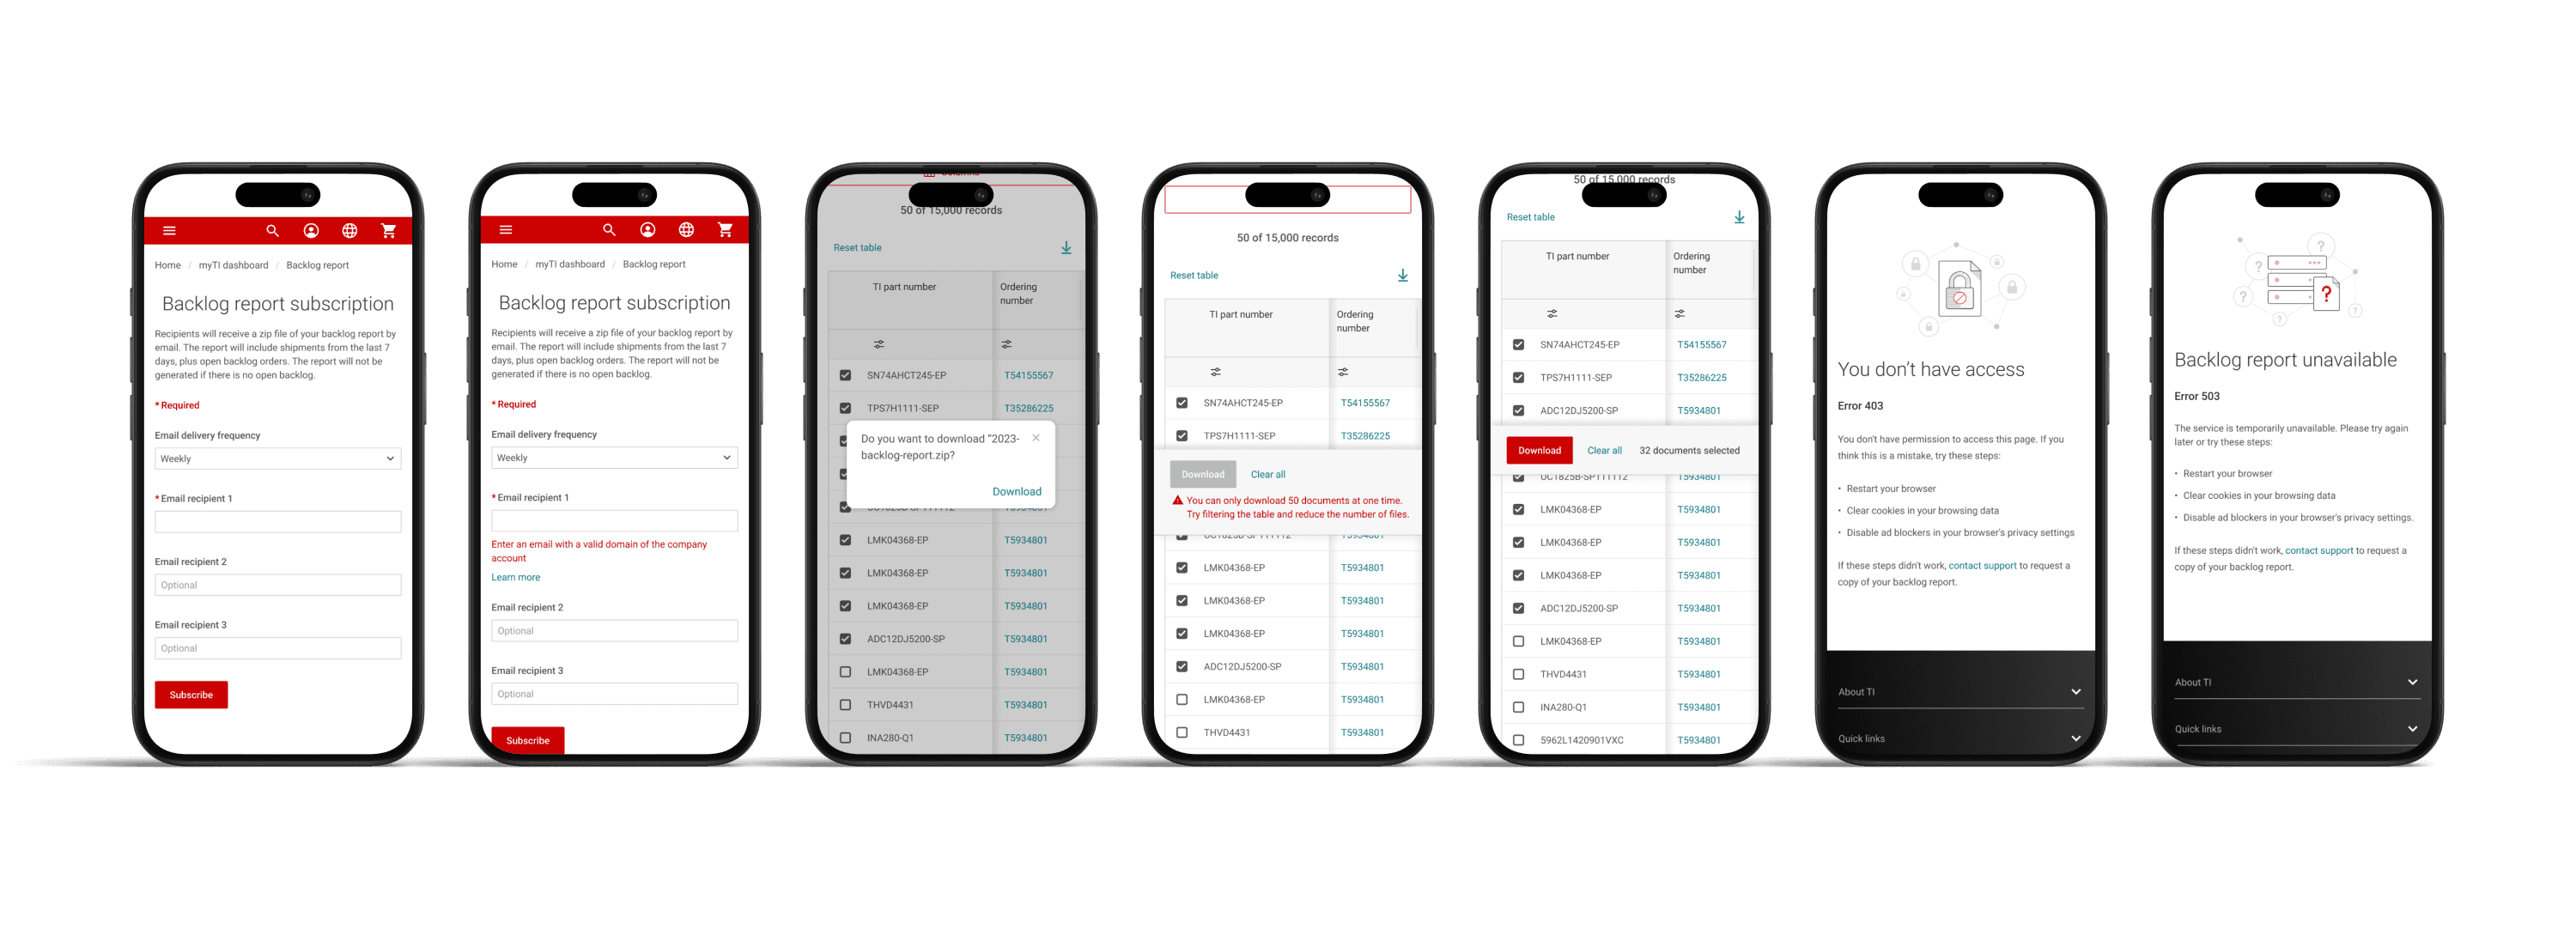
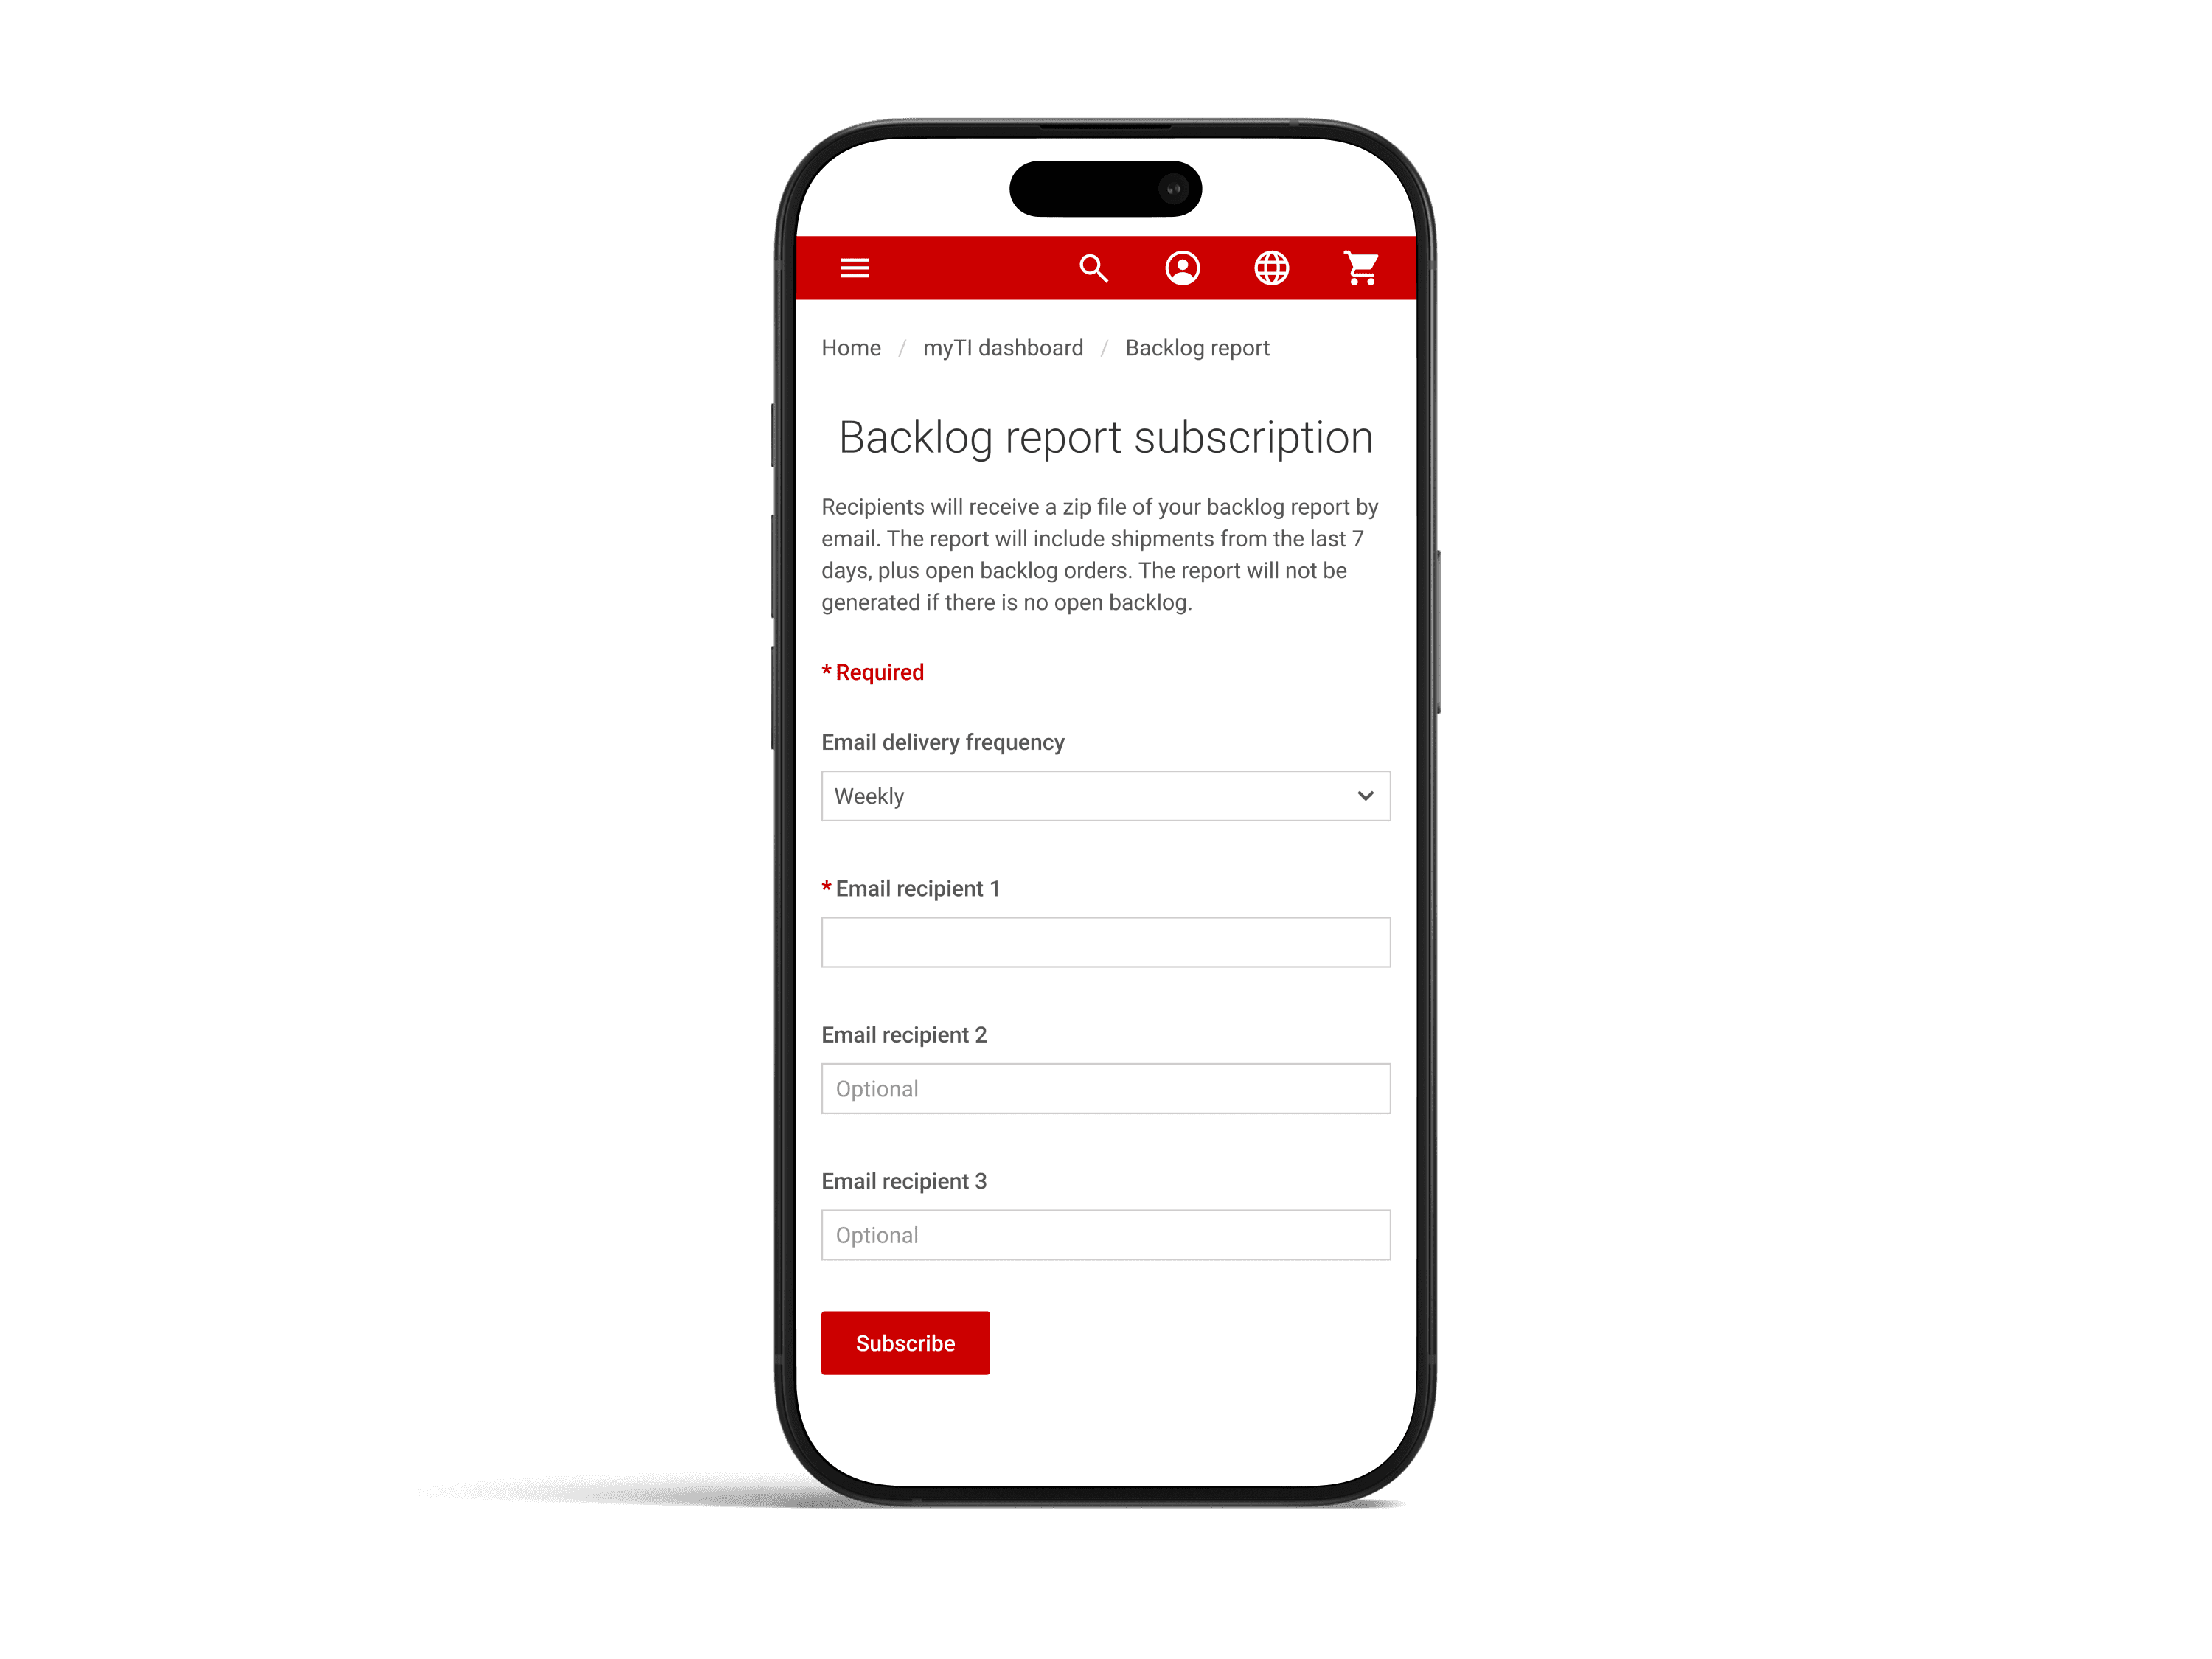
Mobile - Subscription
Enabling customers to subscribe to the report using their phones
Mobile - Alert
Enabling customers to subscribe to the report using their phones
Retrospective
The redesign of the Backlog Report system successfully addressed key pain points by simplifying the user interface, streamlining the flow of information, and enhancing overall accessibility. By focusing on clear categorization, logical question flows, and providing feedback mechanisms, we created an intuitive, user-friendly system that improved both the user experience and internal communication.
The project helped to reduce confusion, minimize errors, and ensure users could easily track and manage their backlog reports.
What I have learnt.
I gained a deeper understanding of how crucial it is to prioritize the needs and pain points of the users. By focusing on simplifying complex tasks, I learned how to create designs that are intuitive and enhance overall workflow efficiency.
I realized the importance of an iterative design process. Through continuous testing and feedback, I was able to refine the system to address user challenges and ensure the final product met their expectations.